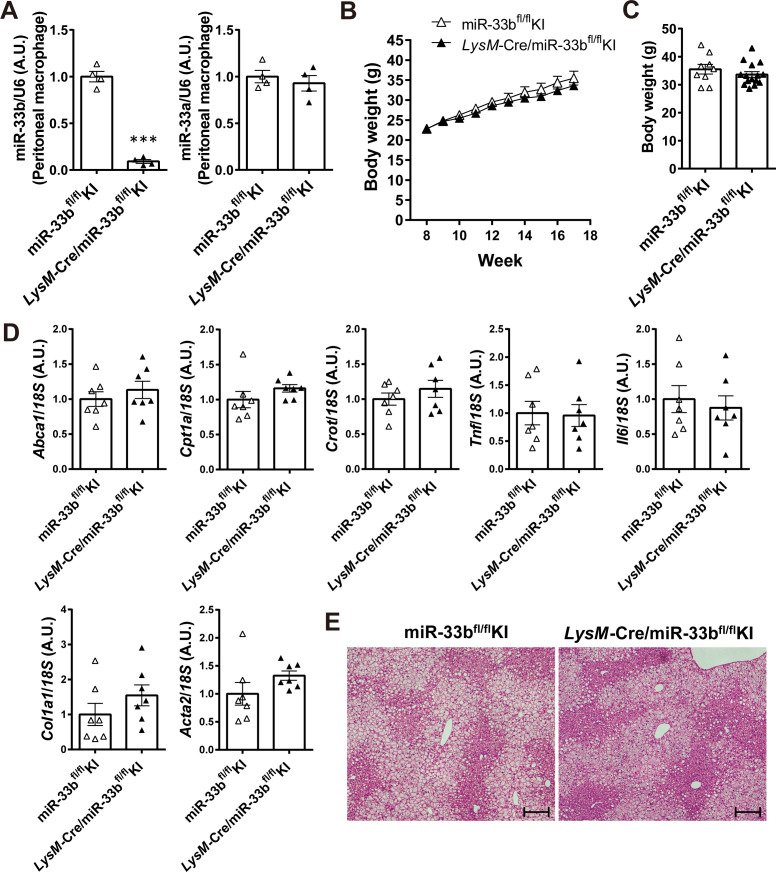
Figure S5. LysM-Cre/miR-33bfl/fl KI mice have a lower impact on HFD-induced NASH.
(A) Relative expression levels of miR-33b and miR-33a in the peritoneal macrophages of miR-33bfl/fl KI mice and LysM-Cre/miR-33bfl/fl KI mice. n = 4 samples per group; ***P < 0.01, unpaired t test. (B) Body weight change of miR-33bfl/fl KI mice and LysM-Cre/miR-33bfl/fl KI mice under HFD feeding. (C) Body weight at the time of euthanasia of miR-33bfl/fl KI mice and LysM-Cre/miR-33bfl/fl KI mice fed the HFD. n = 9–14 mice per group. (D) Relative expression levels of Abca1, Cpt1a, Crot, Tnf, Il6, Col1a1, and Acta2 in the livers of miR-33bfl/fl KI mice and LysM-Cre/miR-33bfl/fl KI mice fed the HFD. n = 7 mice per group. (E) Representative microscopic images of HE staining of the liver of miR-33bfl/fl KI mice and LysM-Cre/miR-33bfl/fl KI mice fed the HFD. Scale bars: 200 μm.

