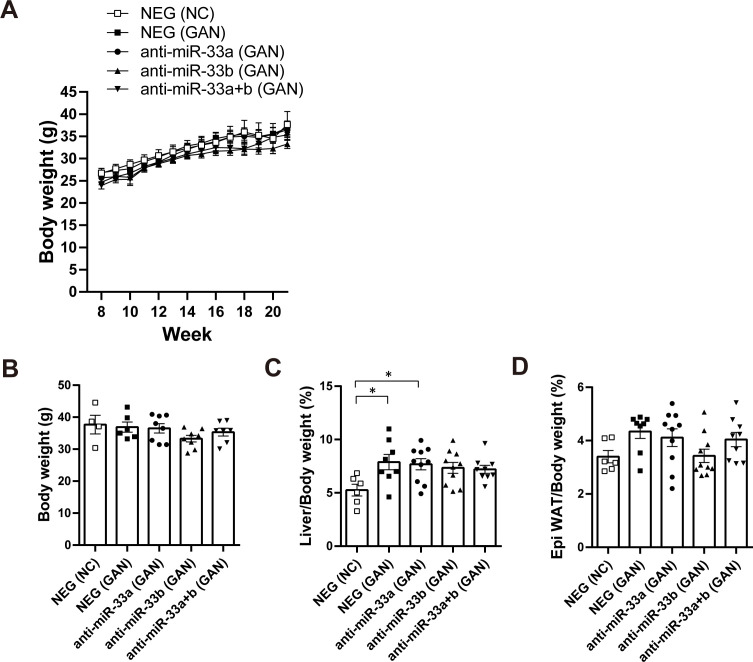
Figure S6. GAN diet–fed miR-33b KI mice treated with AMOs.
(A) Body weight change of the indicated group of mice under NC or GAN diet feeding. (B) Body weight of the indicated group of mice at the time of euthanasia. n = 4–8 mice per group. (C) Percentage of liver weight to body weight of the indicated group of mice. n = 6–8 mice per group; *P < 0.05, one-way ANOVA with Tukey’s post hoc test. (D) Percentage of epididymal white adipose tissue weight to body weight of the indicated group of mice. n = 6–8 mice per group.

