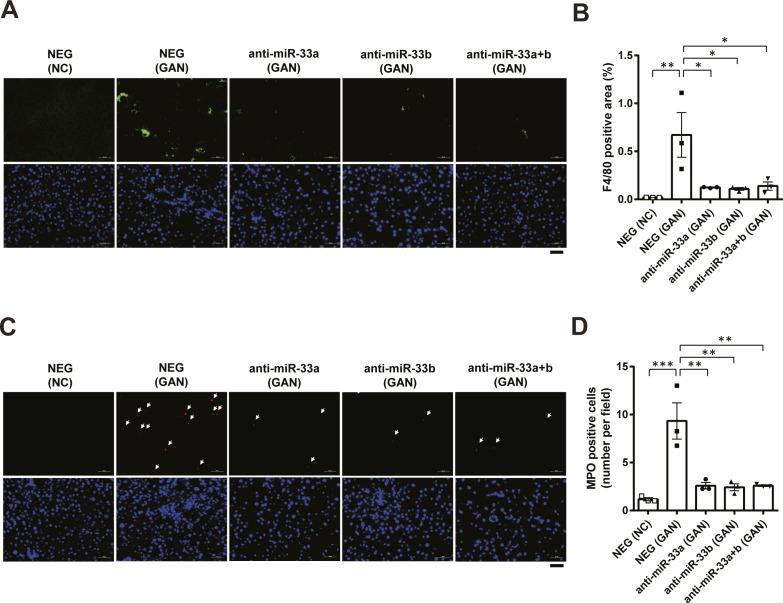
Figure S7. Anti-miR-33 treatment improves GAN diet–induced inflammation.
(A) Representative microscopic images of immunofluorescence staining for F4/80 (green) and DAPI (blue). Scale bars: 50 μm. (B) Quantification of the F4/80-positive area in the liver sections of the indicated groups. n = 3 samples per group; *P < 0.05 and **P < 0.01, one-way ANOVA with Tukey’s post hoc test. (C) Representative microscopic images of immunofluorescence staining for MPO (red) and DAPI (blue). Scale bars: 50 μm. (D) Quantification of the MPO-positive cells in the liver sections of the indicated groups. n = 3 samples per group; **P < 0.01 and ***P < 0.001, one-way ANOVA with Tukey’s post hoc test.

