
Figure 2.
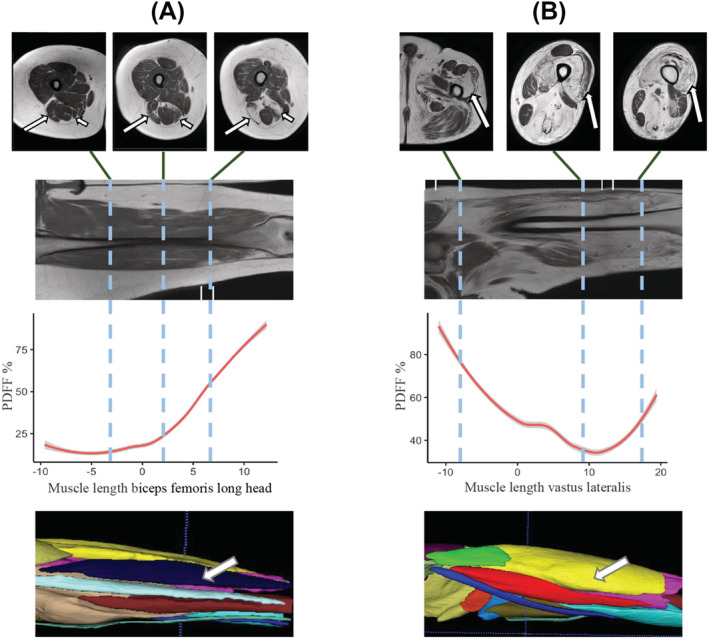
Examples of non‐uniform muscle fat replacement in LGMDR12. For two patients (A, B), three axial T1 MRI slices are shown that highlight the non‐uniform distribution of muscle fat replacement along the length of individual muscles. The coronal T1 image shows the location of the axial slices. Next, we quantified this non‐uniform distribution in the graph displaying the PDFF of the selected muscle along the length of the thigh for this patient. The thickest part of the muscle is centered at ‘0’ on the x‐axis in centimetres, with the more proximal part of the muscle shown to the left (negative values) and more distal part shown to the right (positive values). Finally, a 3D segmentation model of the thighs is shown, which is used to calculate the PDFF. (A) The biceps femoris long head (long arrows) of the right leg is shown in three different locations along the thigh, highlighting the variation in the degree of fat replacement. The long arrow in the 3D segmentation model also points to this muscle. Short arrows in the axial T1 image point towards the semimembranosus muscle, in which there is also a clear non‐uniform fat replacement (not further shown). (B) Long arrows: Vastus lateralis muscle of the left leg.