
Figure 4.
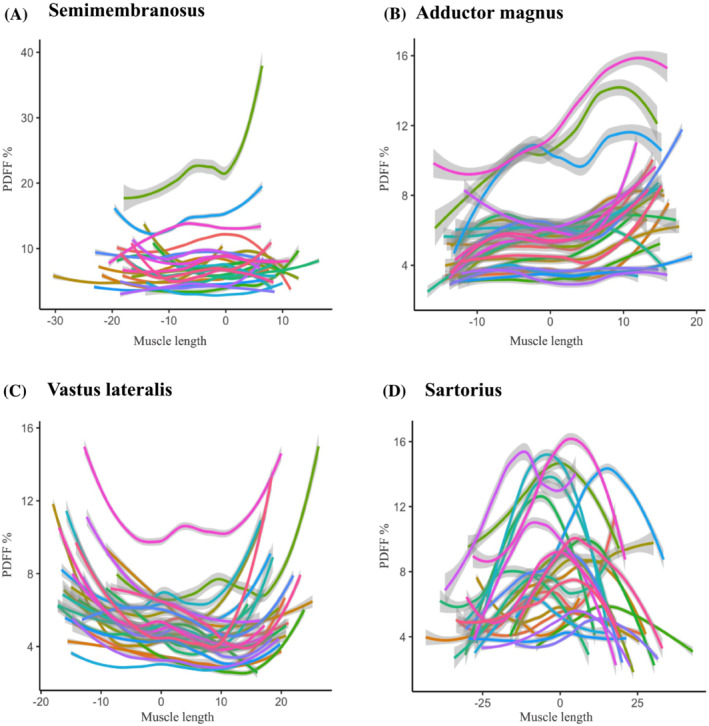
Profiles of PDFF along the length of thigh muscles in healthy controls. The same muscles as in Figure 3 are shown for the control group. Each control individual is indicated in another coloured line. Healthy controls generally show less variation between subjects than patients, with a clearly visible pattern of intramuscular fat distribution for each muscle. Note that this pattern often shows marked similarities with the distribution of fat replacement in LGMDR12 patients.