Figure 4.

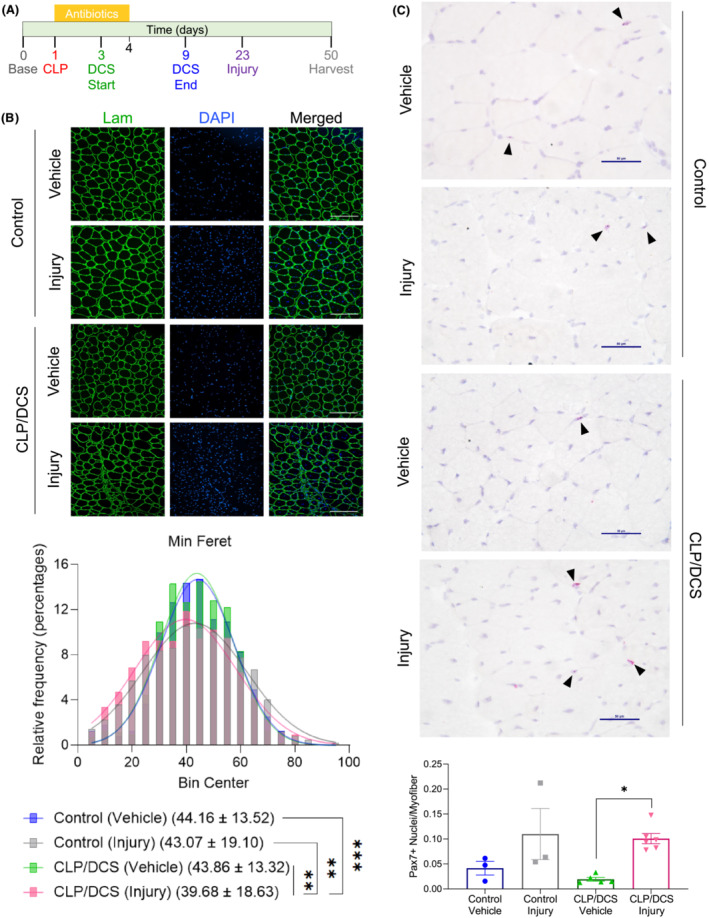
Muscle recovery deficit in post‐sepsis mice with secondary muscle injury. (A) Timeline depicting experimental setup of second insult to muscle in control and cecal ligation and puncture/daily chronic stress (CLP/DCS) mice. (B) Immunofluorescence images (top) and minimum Feret diameter quantification (bottom) of tibialis anterior (TA) cross‐sections in control or CLP/DCS mice that received vehicle or BaCl2 (injured) injections. Green = laminin, Blue = DAPI. Images are ×20 with scale bar = 200 μm. (C) Pax7 staining (top) and quantification of Pax7‐postive nuclei per myofibre of TA cross‐sections from vehicle or injured control and CLP/DCS mice. Purple = haematoxylin (nuclei), Red = Pax7. Images are ×40 with scale bar = 50 μm. All images are representative. B = nonlinear fit pairwise comparisons, see Table S6 for all P values from all comparisons. C = One‐way ANOVA with Bonferroni multiple comparisons (BMC). Significance is *P < 0.05, **P < 0.01, ***P < 0.001. N = 3–6. Each n = one mouse.
