
Figure 5.
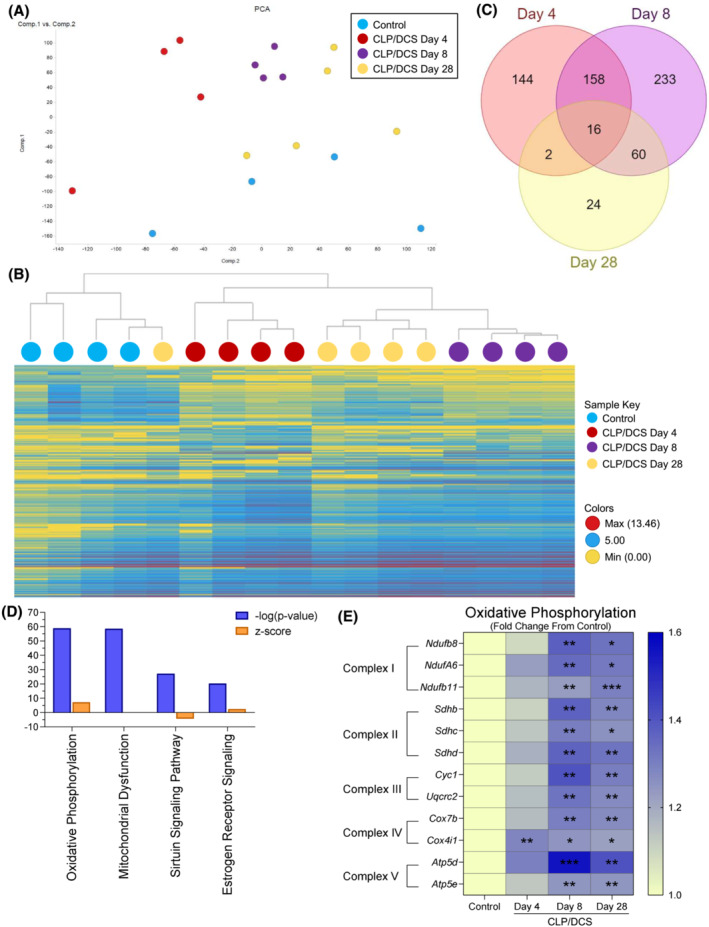
Post‐septic satellite cell RNA seq reveals metabolic defects potential contributions to long term functional deficits. Combined experiment (A) principal component analysis (PCA) of control and cecal ligation and puncture/daily chronic stress (CLP/DCS) Days 4, 8 and 28 utilizing all gene transcriptomic data. (B) Hierarchical clustering by means of combined differentially expressed genes from CLP/DCS Days 4, 8 and 28 versus control using 2 < Log2FC < −2, P < 0.05. (C) Venn diagram illustrating the overlap in significantly altered genes in CLP/DCS Days 4, 8 and 28 samples versus control, where 2 < Log2FC < −2, P < 0.05. (D) Top 4 altered pathways from ingenuity pathway analysis (IPA) in CLP/DCS Day 28 versus control samples. Orange bars indicate z‐score, blue bars indicate ‐log(P‐value). (E) Heatmap of significantly altered oxidative phosphorylation genes in CLP/DCS Day 28 versus control (depicted as Log2 transcript expression [FPKM] of CLP/DCS Days 4, 8 and 28 as a fold change from control) that are represented in more than one of the top 4 altered pathways from IPA; Ndufa6, Ndufb8 transcript variant 1, Ndufb11, Sdhb, Sdhc, Sdhd, Cyc1, Uqcrc2, Cox4i1 transcript variant 1, Cox7b, Atp4d transcript variant 2 and Atp5e. Significance indicated is versus control. B = Clustering method: complete linkage; distance measure: correlation. E = One‐way ANOVA with Bonferroni multiple comparisons (BMC) whereby significance is *P < 0.05, **P < 0.01, ***P < 0.001. n = 4–5. Each n = pooled satellite cells isolated from 2–3 mice. Satellite cells harvested from mice on Day 27 or 28 are labelled as Day 28.