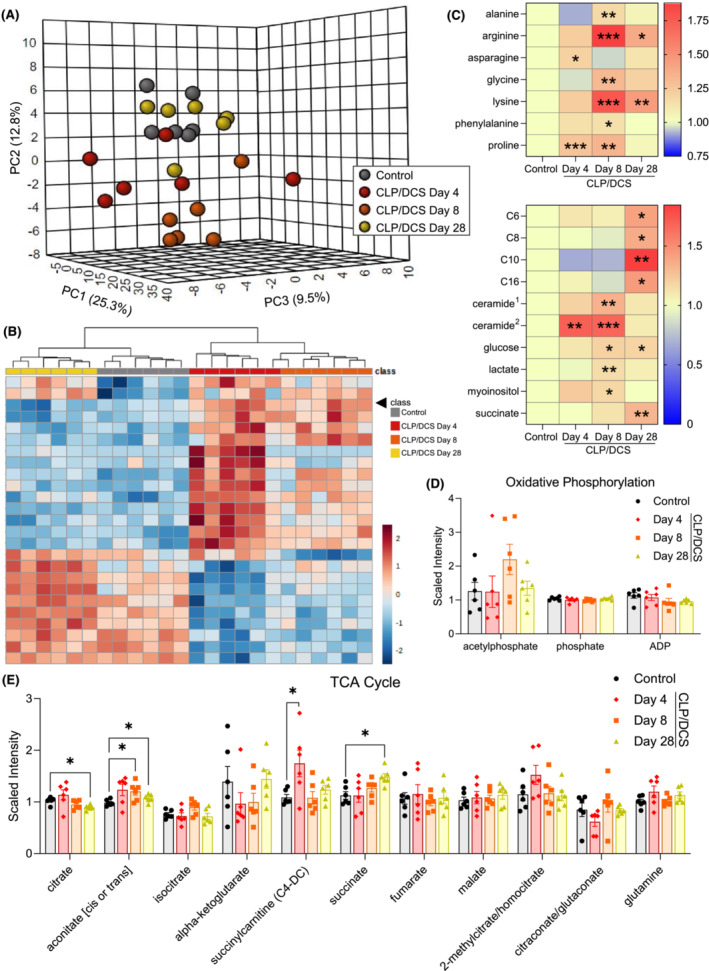
Figure 6.

Alterations in post‐septic gastrocnemius metabolites do not align with metabolic changes observed in satellite cells. (A) 3D principal component analysis (PCA) plot (MetaboAnalyst) utilizing all control, Days 4, 8 and day 28 cecal ligation and puncture/daily chronic stress (CLP/DCS) gastrocnemius metabolite levels. (B) Hierarchical clustering (MetaboAnalyst) of control, CLP/DCS days 4, 8 and 28 using the top 25 altered metabolites. (C) Heatmap depicting increased scaled intensity values, as fold change from control, of metabolites in CLP/DCS gastrocnemius (GR) that are also increased in serum/plasma of septic versus healthy patients or increased in non‐surviving versus surviving sepsis patients. Significance indicated is versus control values. (D, E) Scaled intensity levels of metabolites involved in oxidative phosphorylation (D) or the tricarboxylic acid (TCA) cycle (E) in control, Days 4, 8 and 28 CLP/DCS mice. GR muscles that were harvested on Day 27 or 28 are labelled as Day 28. B = Clustering method: complete; distance measure: Euclidean. C–E = Student's unpaired t‐test with Welch's correction (Metabolon). Significance is *P < 0.05, **P < 0.01, ***P < 0.001. N = 6 per group. Each n = one mouse. C6, hexanoylcarnitine; C8, octanoylcarnitine; C10, decanoylcarnitine; C16, palmitoylcarnitine; ceramide1, ceramide (d18:1/14:0, d16:1/16:0); ceramide2, ceramide (d18:2/24:1, d18:1/24:2).
