
Figure 1.
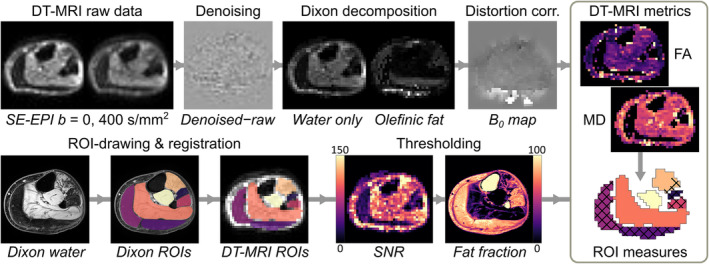
Schematic showing the diffusion‐tensor magnetic resonance imaging (DT‐MRI) processing pipeline for this study. Representative axial spin‐echo echo planar imaging (SE‐EPI) DT‐MRI and chemical‐shift‐based water‐fat separation, or ‘Dixon’s;, images from the lower leg are shown for a 59‐year‐old Becker muscular dystrophy patient. The top row shows the DT‐MRI raw data, which undergo denoising, Dixon fat‐water decomposition to remove olefinic fat, and distortion correction. The bottom row shows region of interest (ROI) drawing on Dixon images, registration of ROIs to the DT‐MRI data and pixel‐wise thresholding based on low signal‐to‐noise ratio (SNR) and high fat fraction. ROIs, with excluded pixels indicated by a crosshatch pattern, are then used to obtain conventional DT‐MRI and random permeable barrier model metrics per muscle. FA, fractional anisotropy; MD, mean diffusivity.