Figure 5.

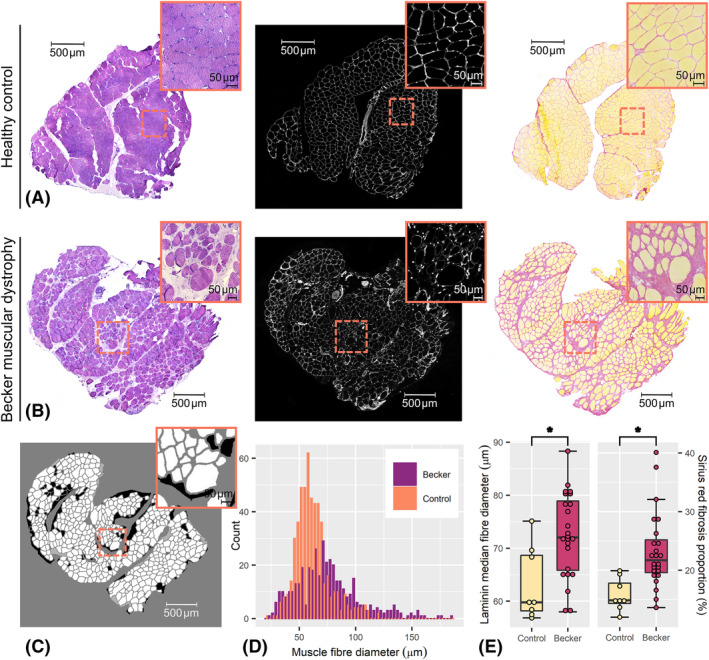
Representative histology images from this study, with zoomed‐in region inset, and examples of intra‐ and inter‐individual distributions. (A) From left to right, example haematoxylin and eosin, laminin and Sirius‐red images, respectively, from a tibialis anterior muscle sample taken from a 48‐year‐old healthy control; and (B) from a 37‐year‐old Becker muscular dystrophy (BMD) patient. (C) An example of semi‐automatic segmentation of the BMD laminin image shown in (B). (D) Histograms showing the distributions of muscle fibre diameters obtained by segmentation of laminin images in (A) and (B); it can be seen that the BMD laminin image contains a broader distribution of fibre sizes, with a trend towards larger fibres, as compared with the control. (E) Boxplots showing the inter‐individual distributions of median laminin‐derived fibre size (left) and the relative area of fibrosis (right), per sample. BMD patients show significantly larger fibre sizes, along with a greater proportion of fibrosis, as compared with controls; however, the inter‐individual variance in median fibre diameter was similar between patients and controls. *Statistically significant group difference at the P = 0.05 level.
