Figure 3.

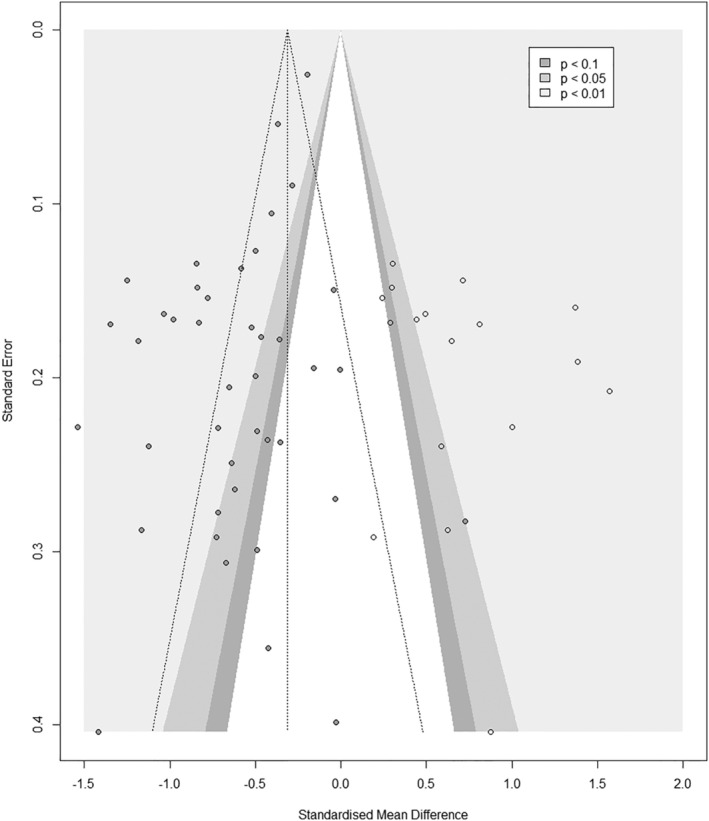
Contour Enhanced funnel plot for cross‐sectional studies on sarcopenia and quality of life – Trim and Fill method (the 18 imputed studies are represented by circles that have no filled colour).

Contour Enhanced funnel plot for cross‐sectional studies on sarcopenia and quality of life – Trim and Fill method (the 18 imputed studies are represented by circles that have no filled colour).