
Figure 3.
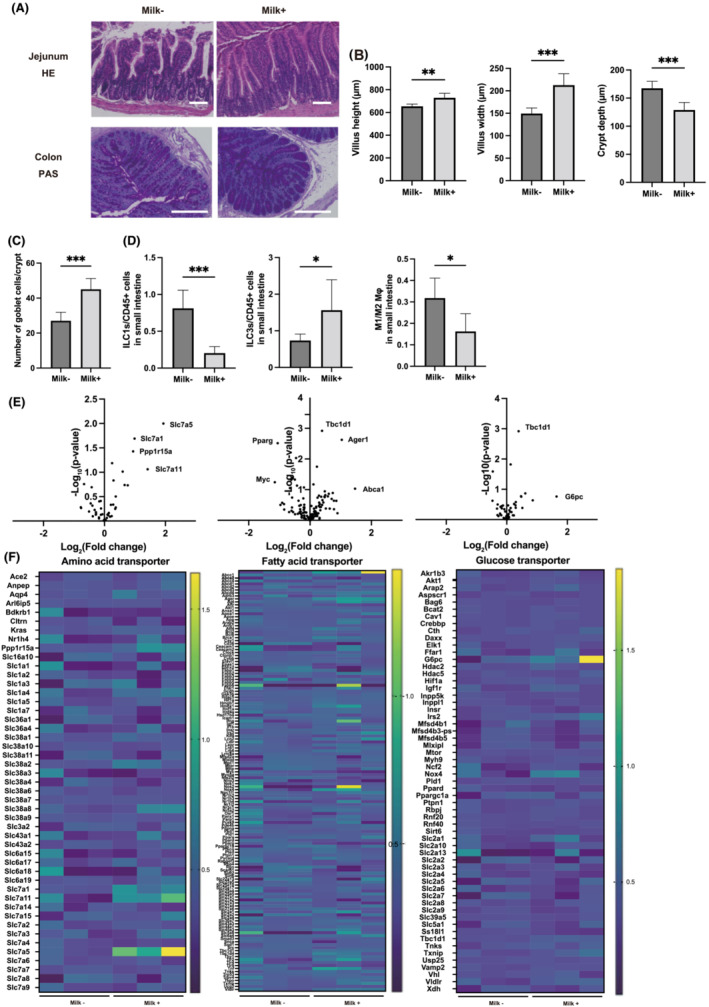
Administration of milk improved the inflammation in the intestine. (A) Representative images of haematoxylin and eosin (HE)‐stained jejunum and periodic acid Schiff (PAS)‐stained colon sections. Jejunum and colon tissues were collected at 16 weeks of age. The scale bar shows 100 μm. (B) Villus height and width, and crypt depth (n = 6). (C) Total goblet cells/crypt (n = 6). (D) Percentages of ILC1s to CD45‐positive cells and ILC3s to CD45‐positive cells, and ratio of M1 macrophages to M2 macrophages in the small intestine (n = 6 in each case). (E) Global mRNA expression related with amino acid transporter, fatty acid transporter and glucose transporter was visualized as a volcano plot (n = 3). (F) Global mRNA expression related with amino acid transporter, fatty acid transporter and glucose transporter was visualized as a heatmap (n = 3). Data are represented as the mean ± SD values. Data were analysed using paired t‐test. *P < 0.05, **P < 0.01 and ***P < 0.001.