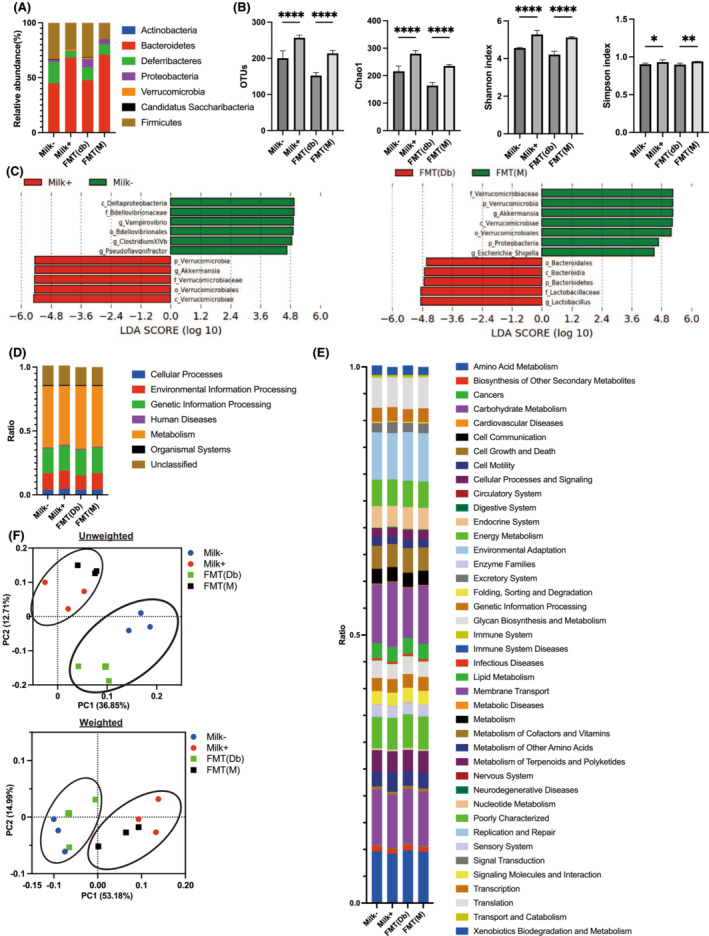
Figure 6.

Components of the gut microbiota. (A) Relative abundance of gut microbiota at the phylum levels (n = 3). (B) Operational taxonomic units (OTUs) (n = 3), Chao1 (n = 3), Shannon index (n = 3) and Simpson index (n = 3). (C) Linear discriminant analysis (LDA) scores of gut microbiota of the Milk− (green) and Milk+ (red) groups and the FMT(db) (green) and FMT(M) (red) groups. (D) Description of Kyoto Encyclopedia of Genes and Genomes (KEGG) pathway class I (n = 3). (E) Description of KEGG pathway class II (n = 3). (F) Unweighted principal coordinate analysis (PCoA) plots and k‐means clustering for gut microbiota and weighted PCoA plots and k‐means clustering for gut microbiota. Data are the mean ± SD values. Data were analysed using one‐way analysis of variance with the Holm–Šídák multiple‐comparison test. FMT, faecal microbiota transplantation. *P < 0.05, **P < 0.01, ***P < 0.001 and ****P < 0.0001.
