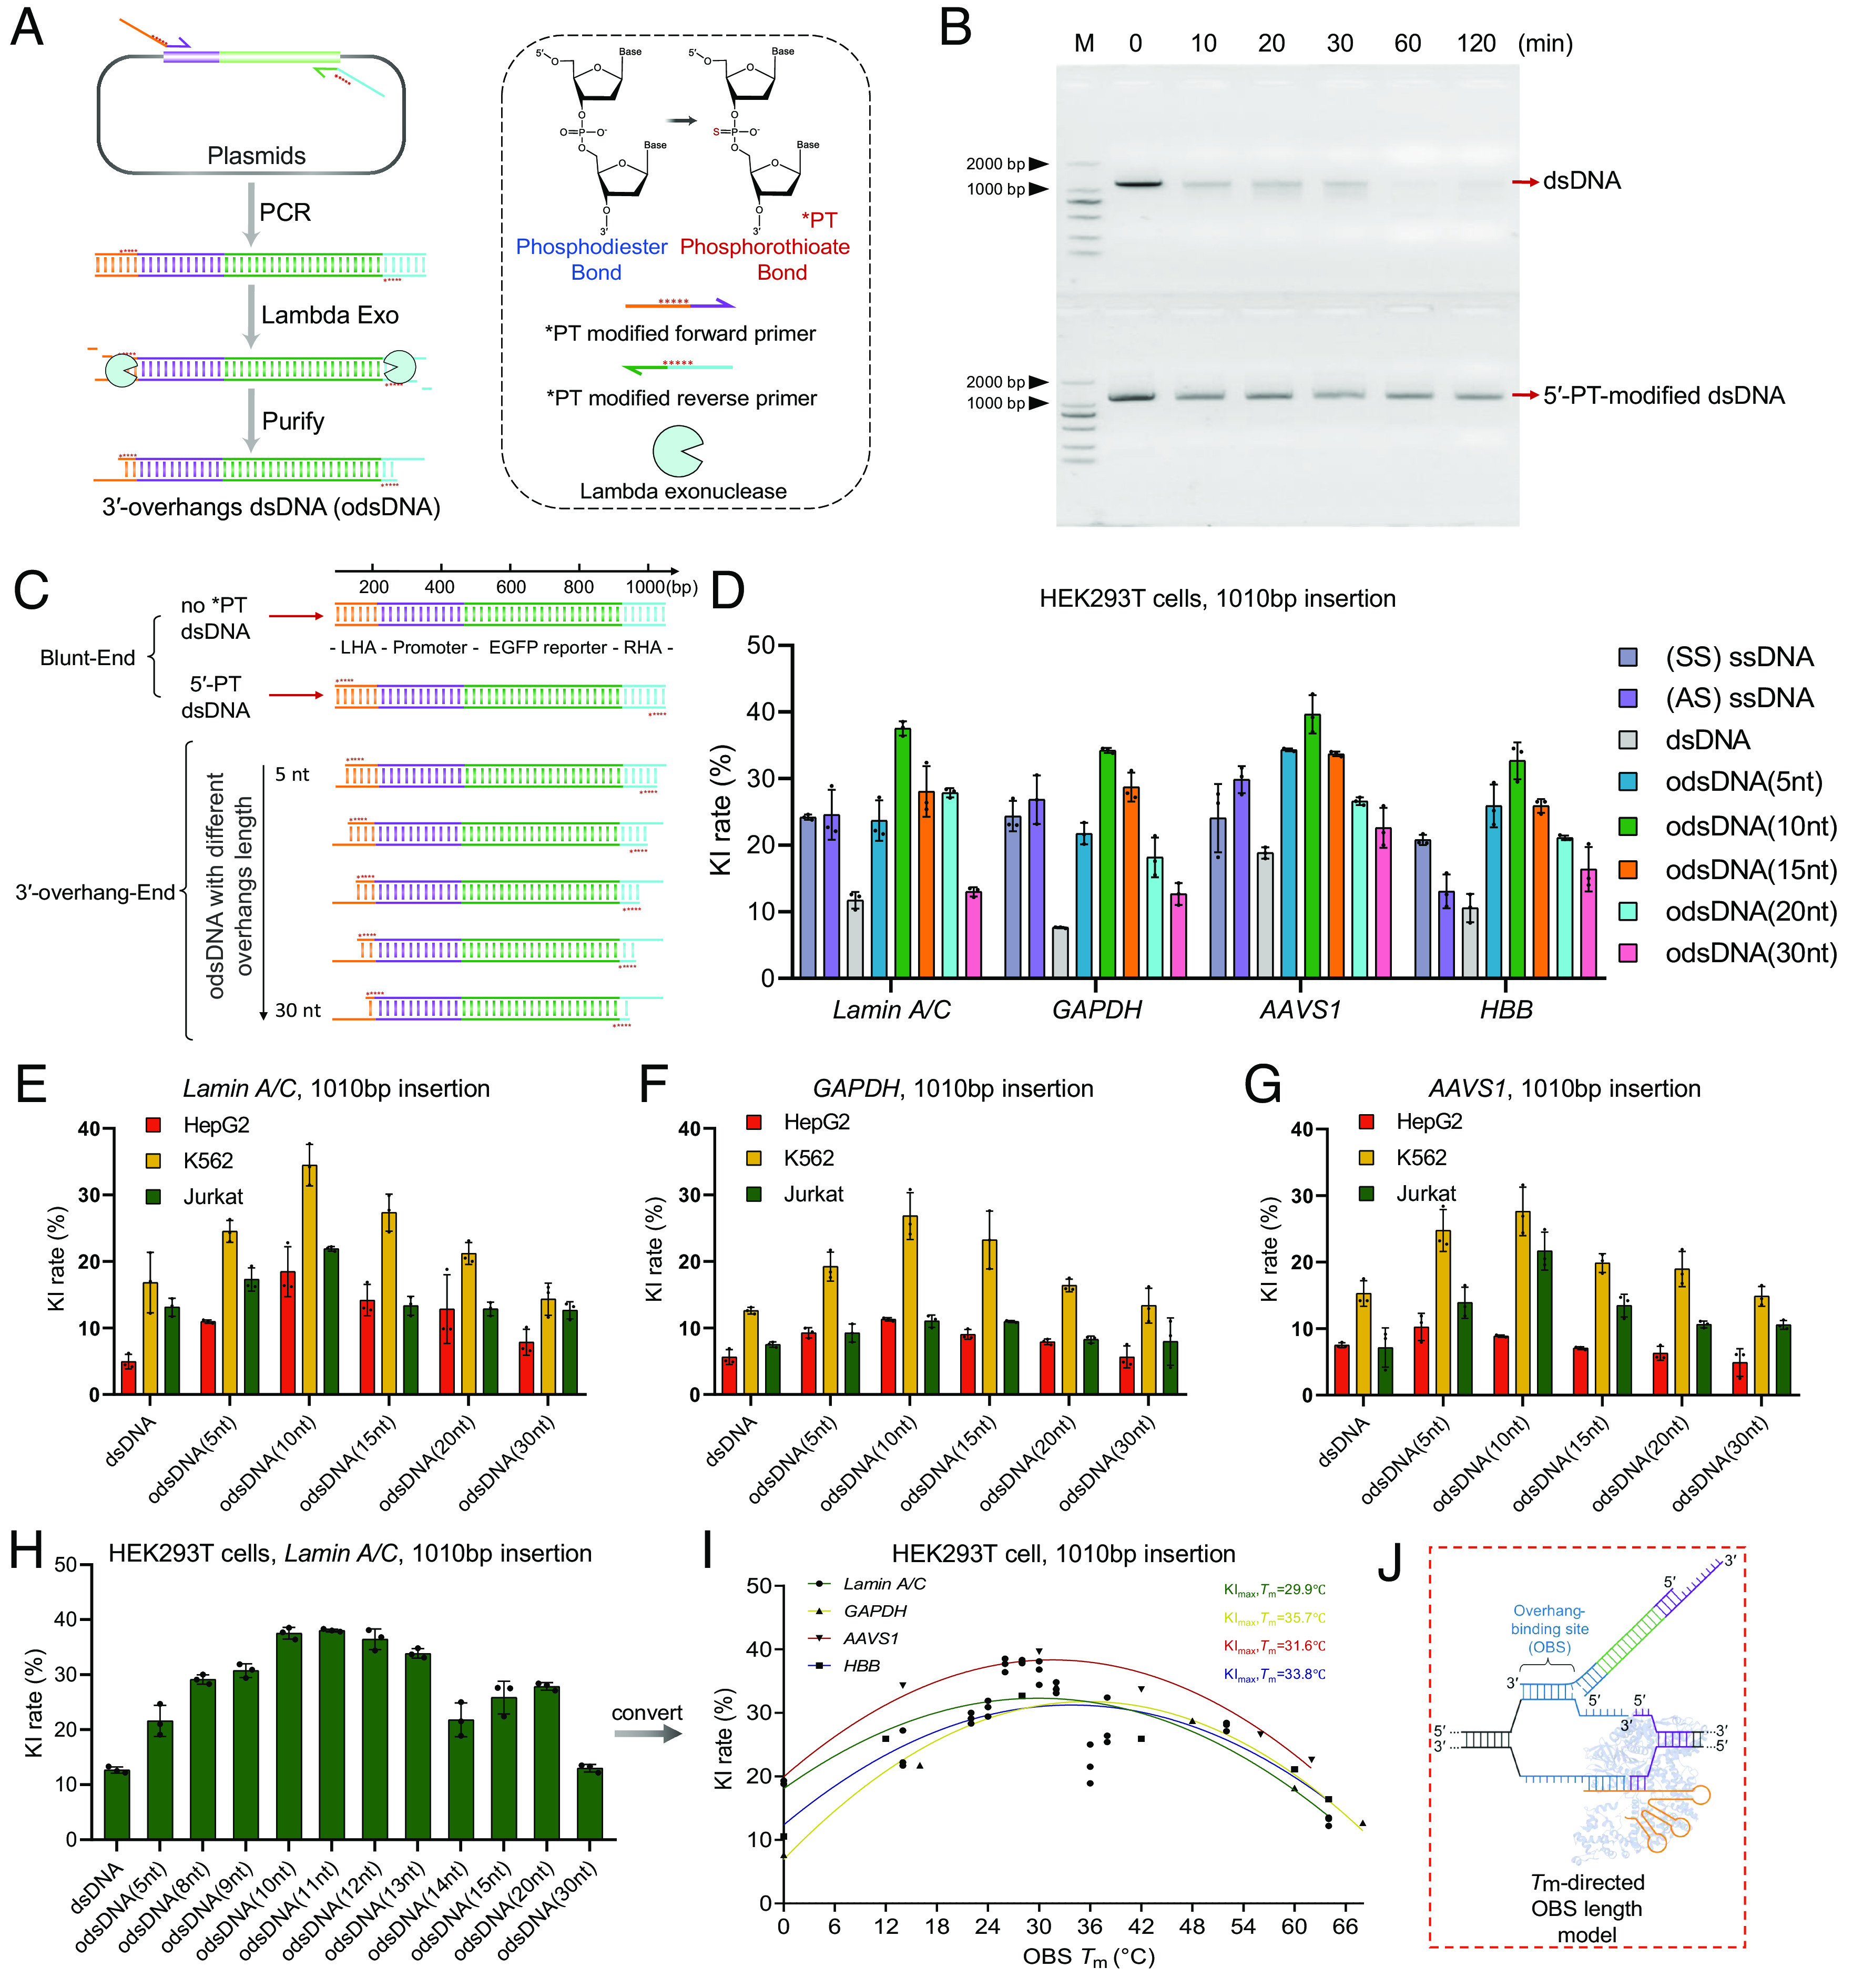
Fig. 2.

Preparation and determination of odsDNA donors with optimal 3′-overhang length as templates for large-fragment KI. (A) Schematic diagram for the generation of odsDNA donors. The odsDNA template was generated through common PCR amplification. Each primer was designed to comprise 50-nt homology arm sequence plus 20-nt base-paring sequence for specific KI template amplification. The 3′-overhang length of the odsDNA donor was specified by five consecutive PT (*) bond modifications, which prevent the 5′- to 3′- overdigestion of the odsDNA donor by Lambda exonuclease. Shown is a KI template consisting of promoter sequence (purple) and EGFP-coding sequence (green). The chemical structure in the figure were drawn by ChemDraw 19.0 software. (B) A representative agarose gel visualization showing the protective effect of PT modification against Lambda exonuclease. The 1,110 bp dsDNA fragments without (above) or with (bottom) five PT modifications were subjected to Lambda exonuclease digestion for varying time lengths as indicated on top. (C) Schematic illustration showing the preparation of 1,010 bp odsDNA donors (containing promoter and EGFP reporter sequences) with variable 3′-overhang lengths (5-, 10-, 15-, 20- and 30-nt). (D) A panel of four different genomic loci was selected for the 1,010 bp odsDNA donor KI in HEK293T cells. The sense ssDNA, antisense ssDNA and dsDNA donors were used as controls. Data were collected 15 d after nucleofection. At the GAPDH locus, the odsDNA donor with 10-nt overhang exhibited increased KI rate by up to 4.38-fold compared with dsDNA donor. (E–G) A side-by-side comparison of the 1,010 bp fragment KI rates using different donors as indicated, across three genomic loci (Lamin A/C, GAPDH and AAVS1) in HepG2 cells, K562 cells, and Jurkat cells, respectively. (H) Comparison of the KI rates using dsDNA and odsDNA donors with varying overhang lengths ranging from 8- to 15-nt at Lamin A/C locus in HEK293T cells. (I) A nonlinear quadratic fitting curve showing the correlation between the Tm of OBS and the KI rates across four loci in HEK293T cells. (J) A highlighted box showing that an optimal OBS Tm helps to raise the KI rate, presumably by stabilizing the duplex, the figure is adapted from figure 1c of Anzalone et al. (35). Data and error bars in D–I indicate the mean and SD of three independent biological replicates.
