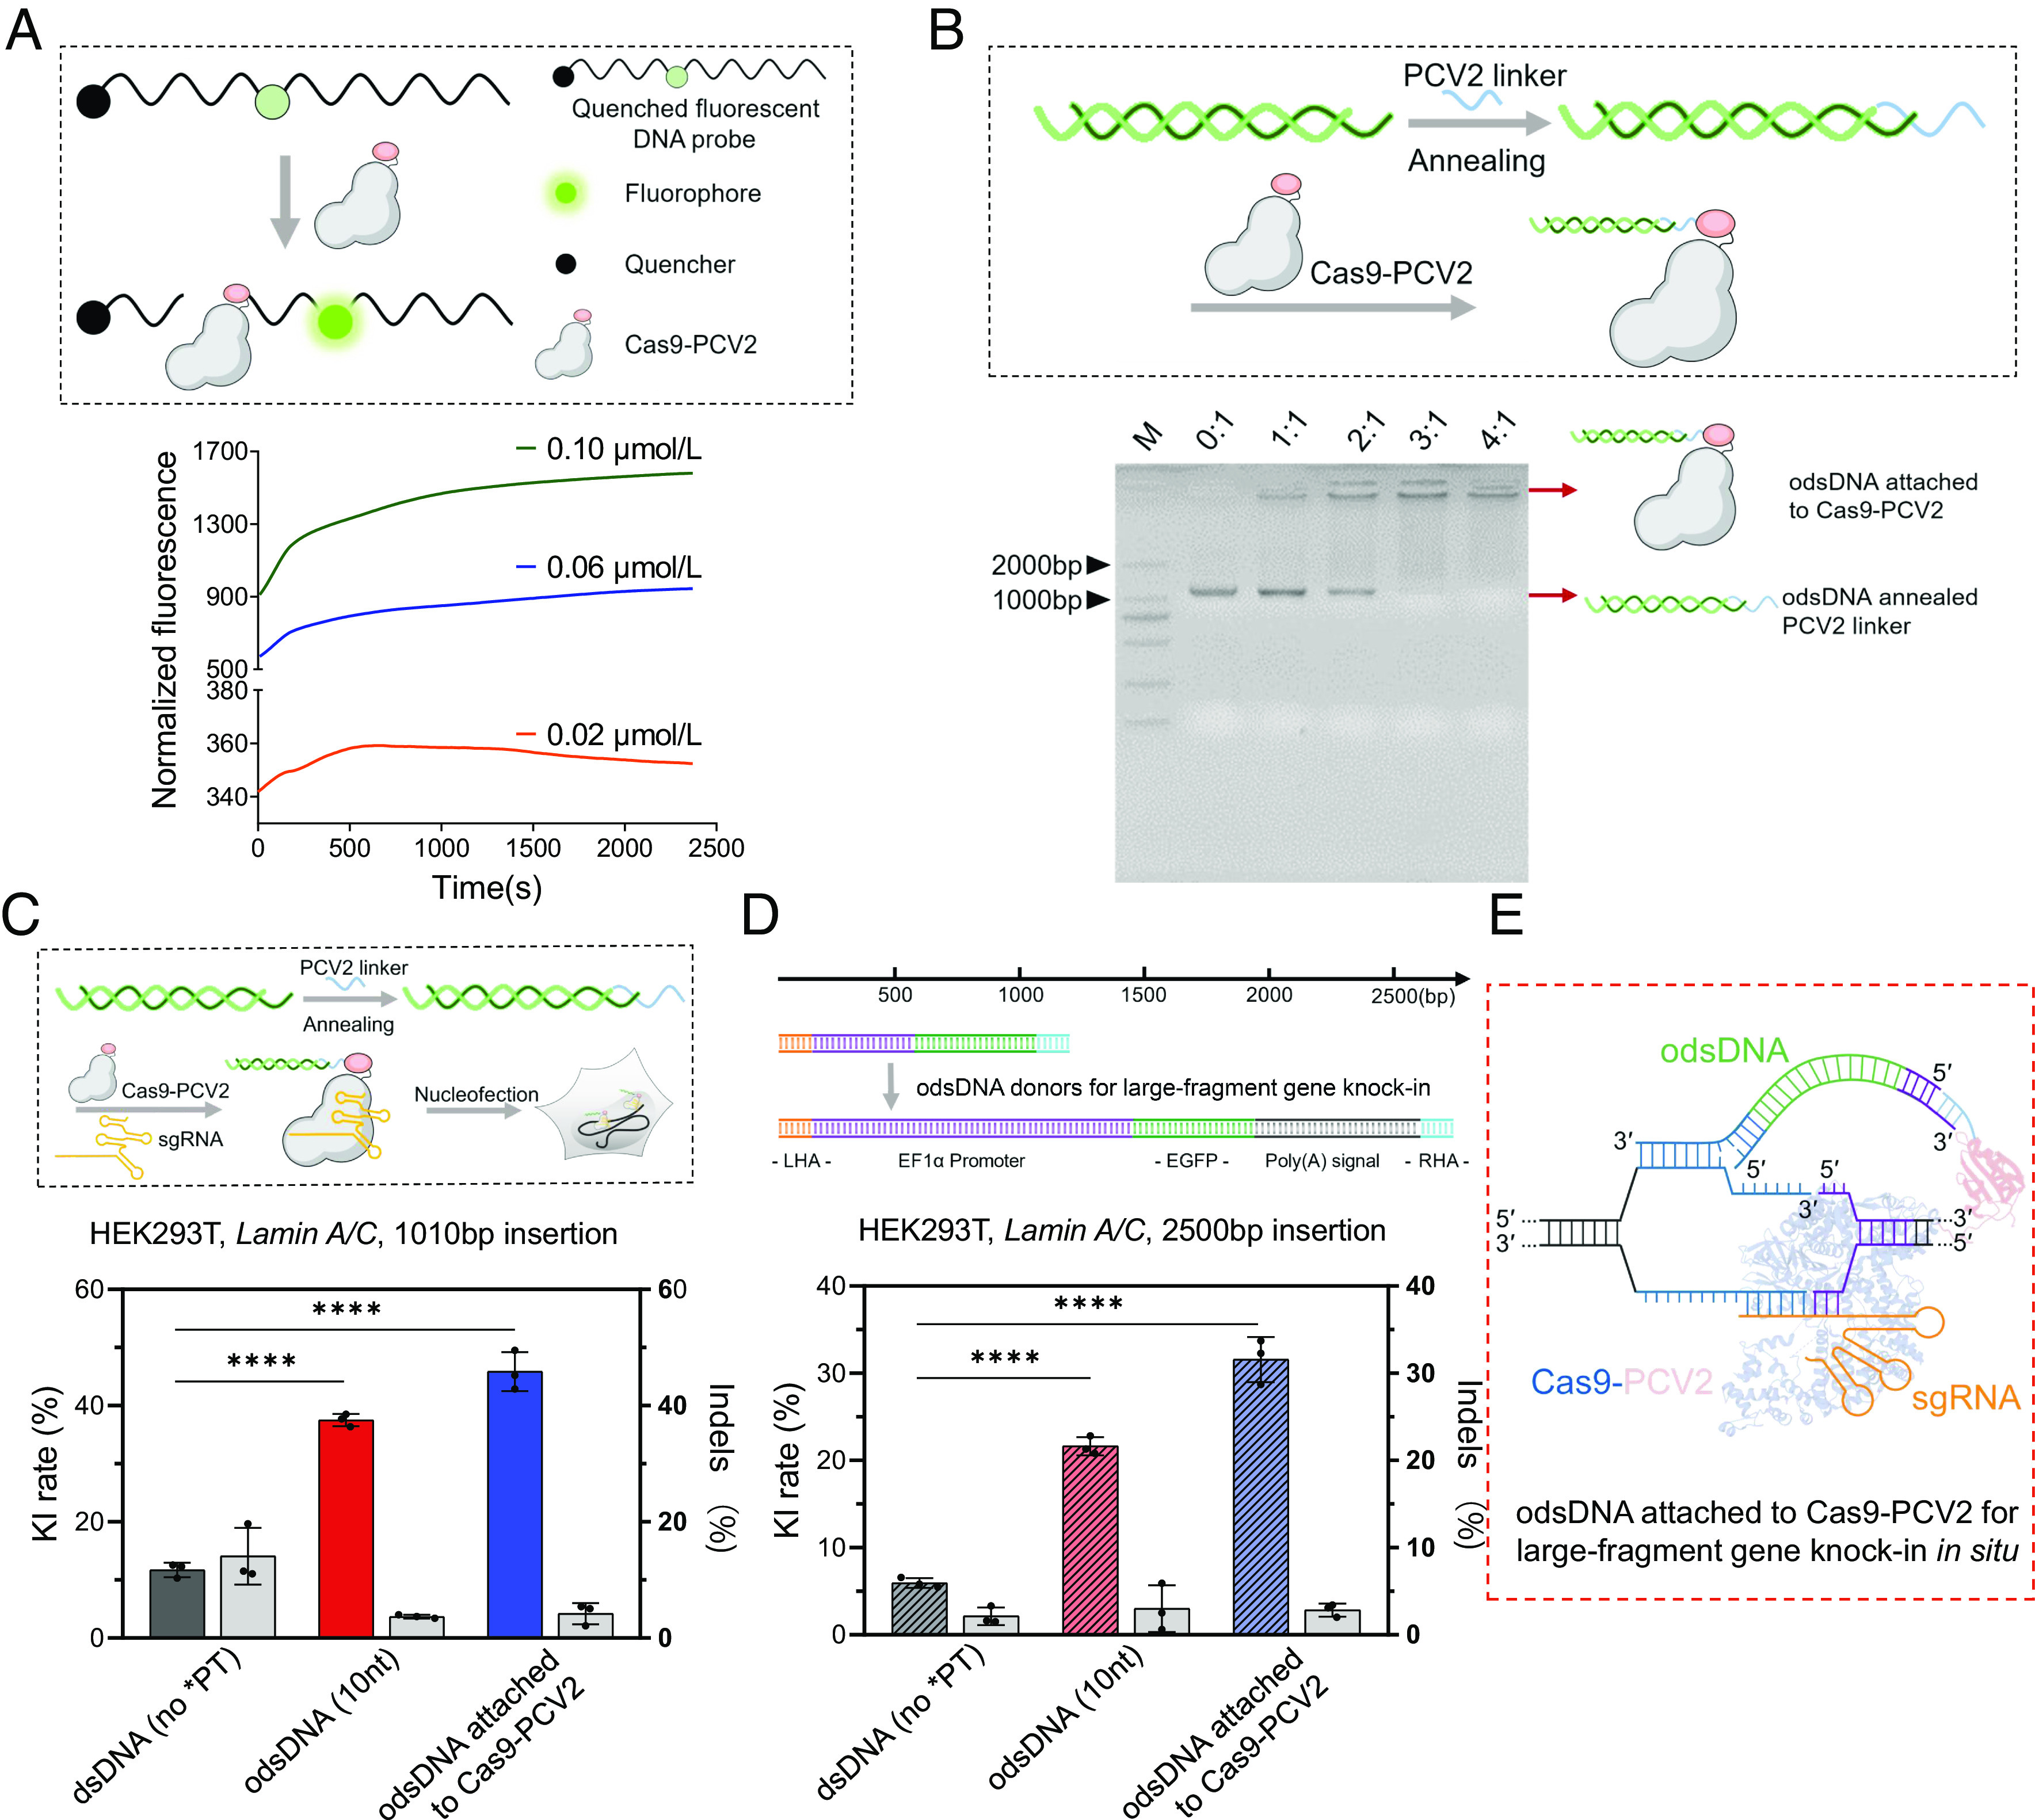
Fig. 4.

Cas9-PCV2 Covalently Tethers odsDNA Donors for Enhanced Gene-Sized KI. (A) Schematic diagram showing the cleavage of FAM-Quenched fluorescent ssDNA probe by Cas9-PCV2 fusion protein, releasing the fluorescent signal (Upper). Kinetic recording of fluorescence curves for the reaction between Cas9-PCV2 and F-Q ssDNA at 0.02 μM, 0.06 μM and 0.1 μM as indicated (Lower). (B) Efficient tethering of odsDNA donors to Cas9-PCV2 through base-pair annealing with variable molar ratios (Cas9-PCV2: pre-annealed odsDNA/linker) as visualized by agarose gel electrophoresis. (C) A schematic diagram illustrating the assembly of the RNPs complex consisting of Cas9/Cas9-PCV2, sgRNA, and odsDNA/linker, for nucleofection (above). The 1,010 bp donor templates, including Cas9-bound dsDNA and 10-nt odsDNA as well as Cas9-PCV2-bound 10-nt odsDNA, were electroporated to target the Lamin A/C locus in HEK293T cells. Both the KI rates and the indel occurrences were plotted for side-by-side comparison (Bottom). On average, the KI frequencies increased up to 3.19-fold and 3.9-fold in odsDNA (10-nt) and Cas9-PCV2 attached odsDNA (10-nt) groups, respectively, as compared with dsDNA donor (Gray bar indicates Indels rate as plotted on the right y axis). (D) A larger gene-sized fragment (2,600 bp, 50 bp HAs on both ends) composed of promoter, EGFP and poly(A) sequences was exploited for electroporation, as performed above at Lamin A/C locus in HEK293T, for examination of insertion-sized effect on KI and indel rates. On average, the KI frequencies increased up to 3.63-fold and 5.29-fold in odsDNA (10-nt) and Cas9-PCV2 attached odsDNA (10-nt) groups, respectively, as compared with dsDNA donor (Gray bar indicates Indels rate as plotted on the right y axis). (E) The dashed box illustrates a putative model where Cas9-PCV2-tethered odsDNA facilitates the duplex annealing between the 3′-overhang of odsDNA and the released genomic DNA strand around the breakage site, the figure is adapted from figure 1c of Anzalone et al. (35). P value was calculated by two-tailed unpaired t test, *P < 0.05, **P < 0.01, ***P < 0.001, ****P < 0.0001. Data and error bars in C and D indicate the mean and SD of three independent biological replicates.
