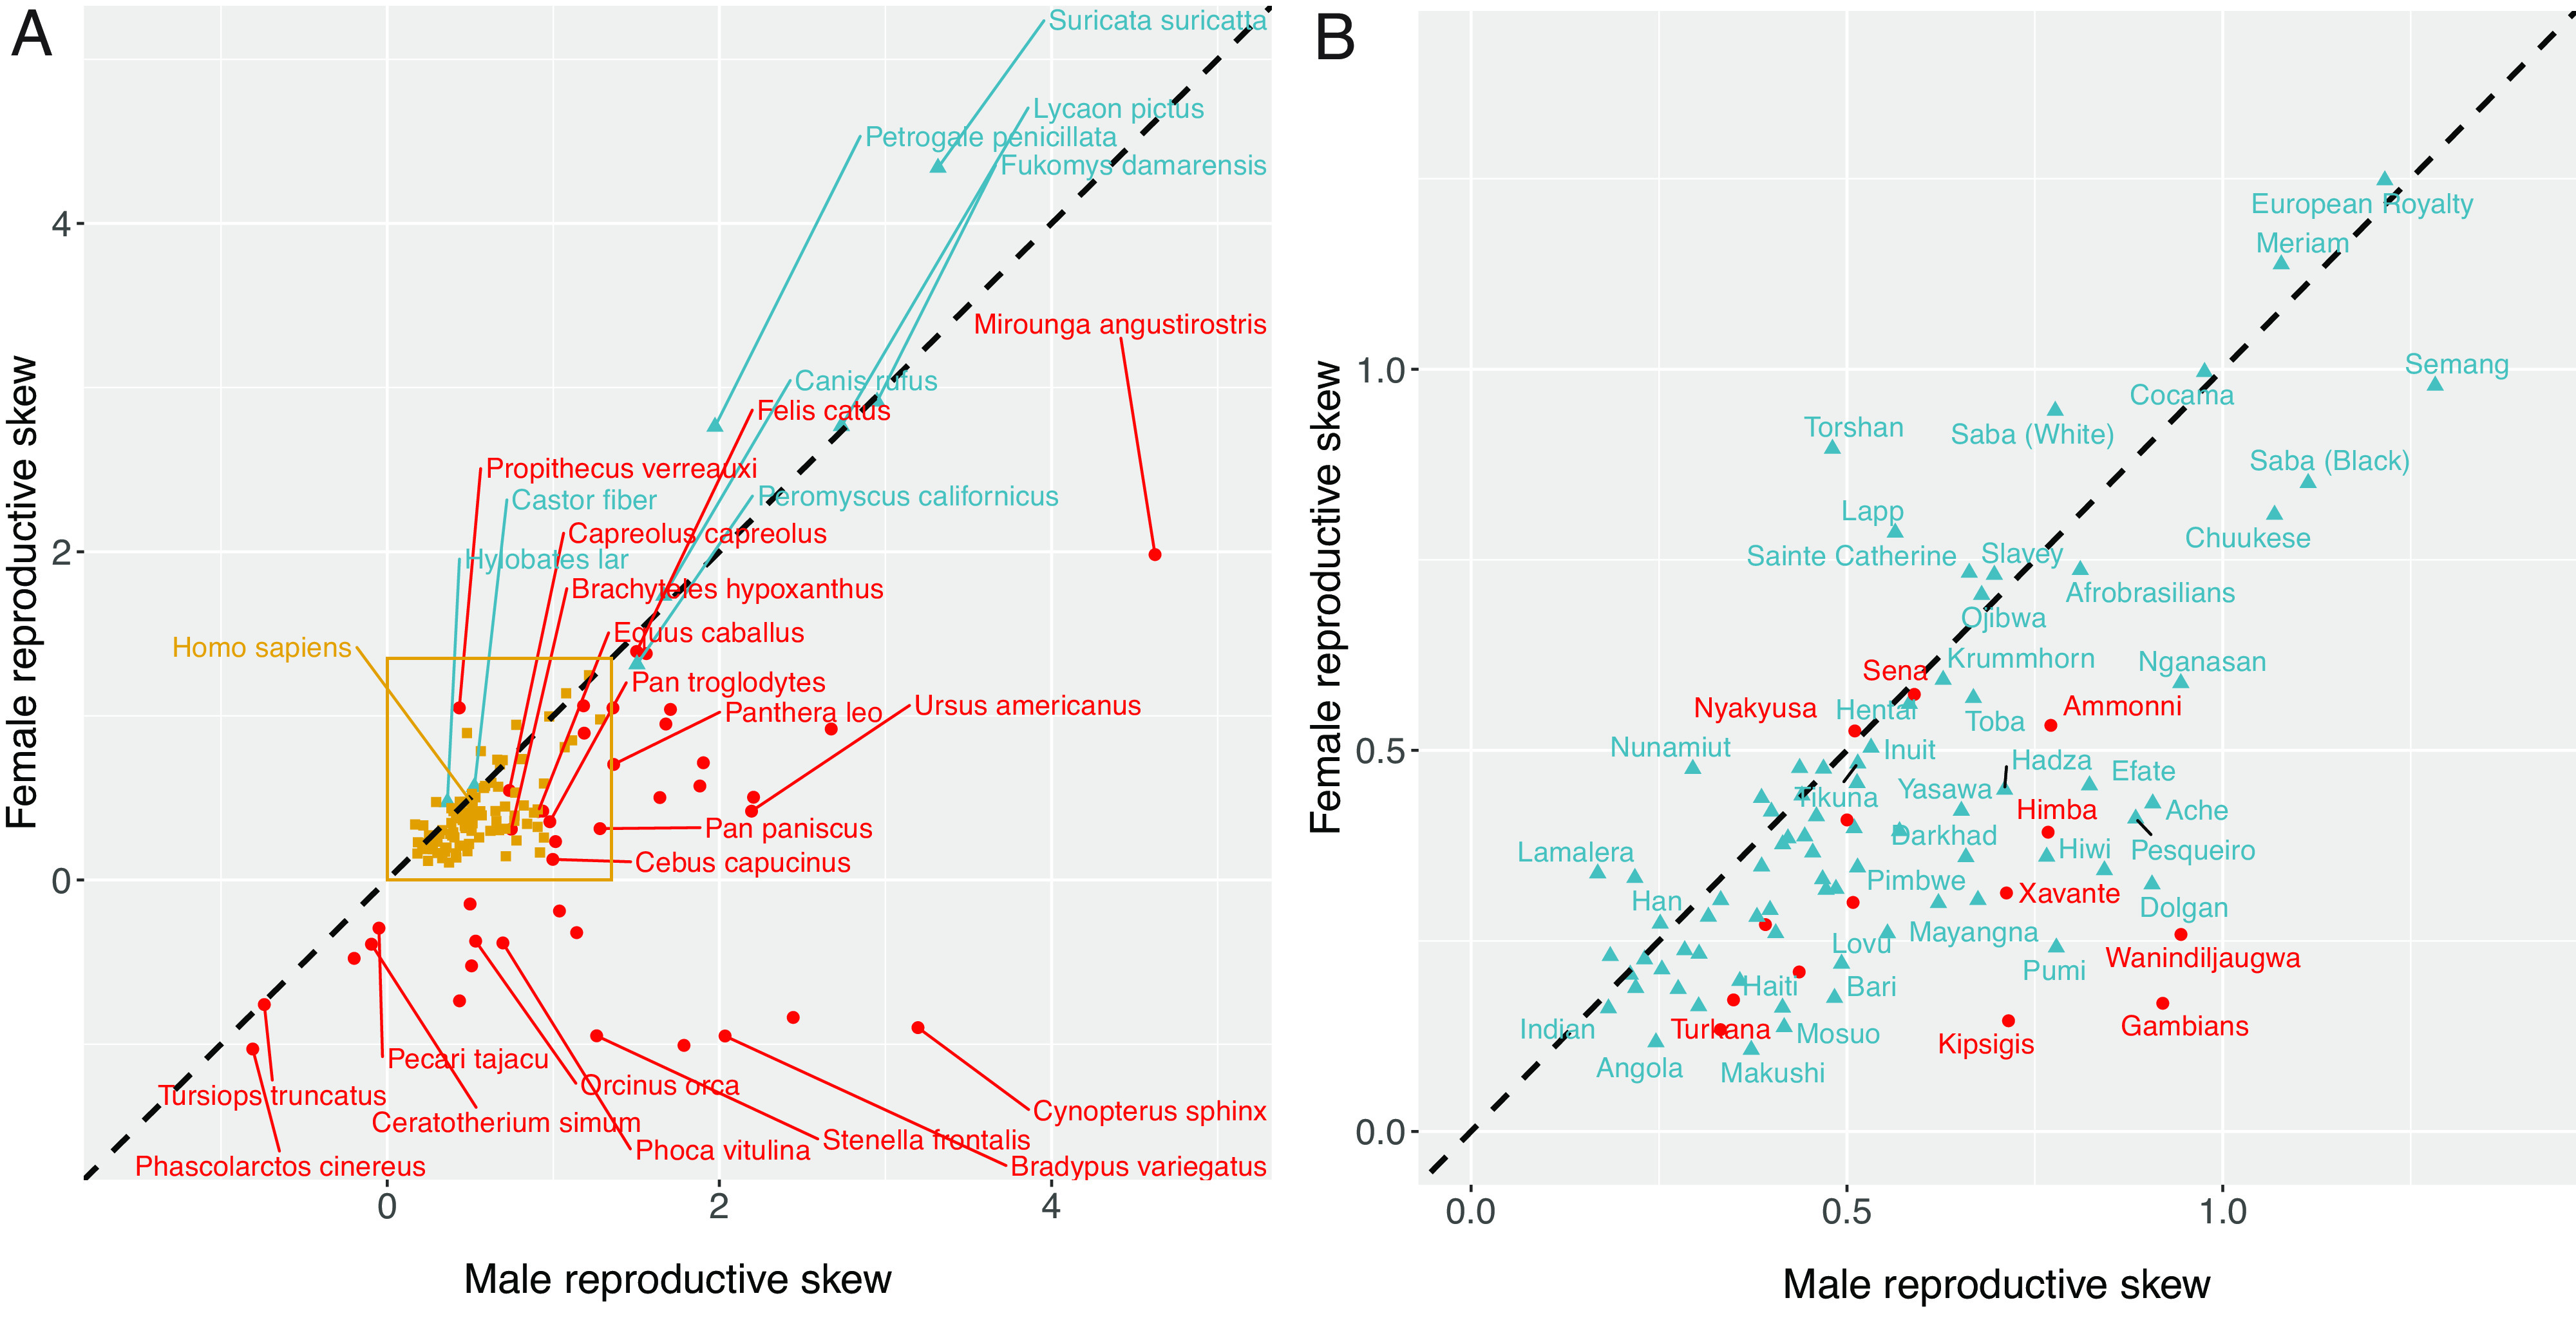
Fig. 2.

Raw data on male and female reproductive skew in mammals (Left) and humans (Right). In panel (A), polygynous nonhuman mammal values are plotted with red circles, monogamous nonhuman mammal values are plotted with blue triangles, and human values are plotted with goldenrod squares. In panel (B), polygynous human values are plotted with red circles, and monogamous human values are plotted with blue triangles. In both panels, points on the dashed diagonal line represent groups with equal male and female skew values. Points below the line indicate groups where male skew exceeds female skew, and vice versa for points above the line. Because M values are very high for some species, we visualize the data using the signed square root transform: . (A) Male and female reproductive skew across species. (B) Male and female reproductive skew across human populations.
