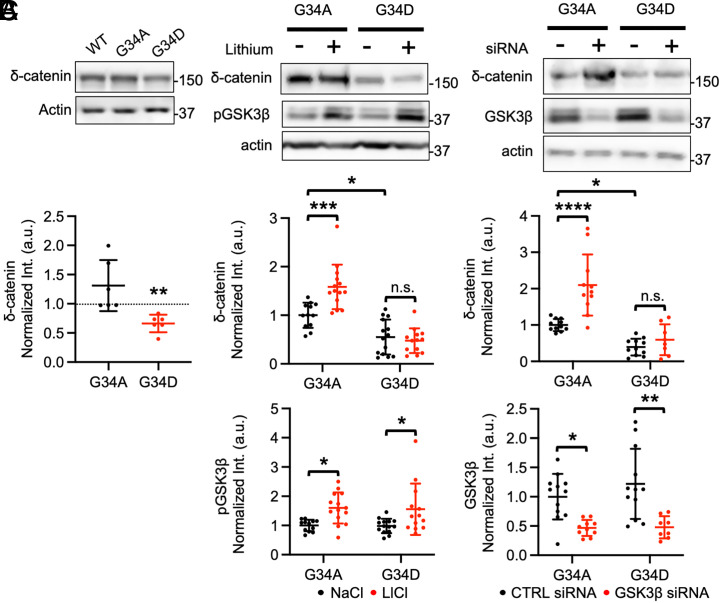
Fig. 2.
Additional δ-catenin mutations confirm enhanced GSK3β-dependent δ-catenin degradation in the G34S mutation. (A) Representative immunoblots and summary graphs of normalized δ-catenin levels in SH-SY5Y cell lysates transfected with WT, G34A, or G34D δ-catenin (n = 6 immunoblots from three independent cultures, Kruskal–Wallis test with Dunn’s test, **P < 0.01). (B) Representative immunoblots and summary graphs of normalized δ-catenin and pGSK3β levels in SH-SY5Y cell lysates transfected with G34A or G34D δ-catenin and treated with 2 mM NaCl (−) or 2 mM LiCl (+) (n = number of immunoblots from three independent cultures. G34A + NaCl = 12, G34A + LiCl = 14, G34D + NaCl = 14, and G34D + LiCl = 13. Two-way ANOVA with the Tukey test, *P < 0.05 and ***P < 0.001. n.s. indicates no significant difference). (C) Representative immunoblots and summary graphs of normalized δ-catenin and GSK3β levels in SH-SY5Y cell lysates transfected with WT or G34S δ-catenin and treated with scrambled (CTRL) (−) or GSK3β (+) siRNA (n = number of immunoblots from three independent cultures. For δ-catenin, G34A + CTRL siRNA = 11, G34A + GSK3β siRNA = 11, G34D + CTRL siRNA = 11, and G34D + GSK3β siRNA = 8. For GSK3β, G34A + CTRL siRNA = 12, G34A + GSK3β siRNA = 10, G34D + CTRL siRNA = 12, and G34D + GSK3β siRNA = 8. Two-way ANOVA with the Tukey test, *P < 0.05, **P < 0.01, and ****P < 0.0001. n.s. indicates no significant difference). The position of molecular mass markers (kDa) is shown on the right of the blots. Mean ± SD.

