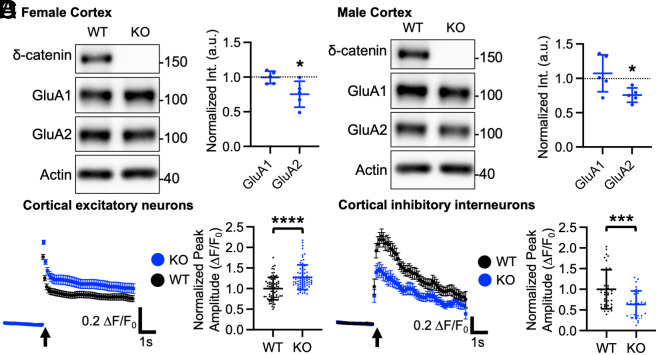
Fig. 5.
A significant reduction of synaptic GluA2 in the δ-catenin KO cortex and altered glutamatergic activity in cultured δ-catenin KO cortical neurons. Representative immunoblots and summary graphs of normalized GluA1 and GluA2 levels in the cortical PSD fractions from WT and δ-catenin KO (A) female and (B) male mice (n = 5 immunoblots from 3 mice in each condition, Kruskal-Wallis test with Dunn’s test, *P < 0.05). The position of molecular mass markers (kDa) is shown on the right of the blots. (C) Average traces of GCaMP7s signals and summary data of normalized peak amplitude in each condition in excitatory neurons (n = number of neurons from 3 independent cultures, WT = 70 and KO = 73). (D) Average traces of GCaMP6f signals and summary data of normalized peak amplitude in each condition in inhibitory interneurons (n = number of neurons from three independent cultures, WT = 38 and KO = 30, ***P < 0.01 and ****P < 0.0001, the unpaired two-tailed Student’s t test). An arrow indicates photostimulation. Mean ± SD.

