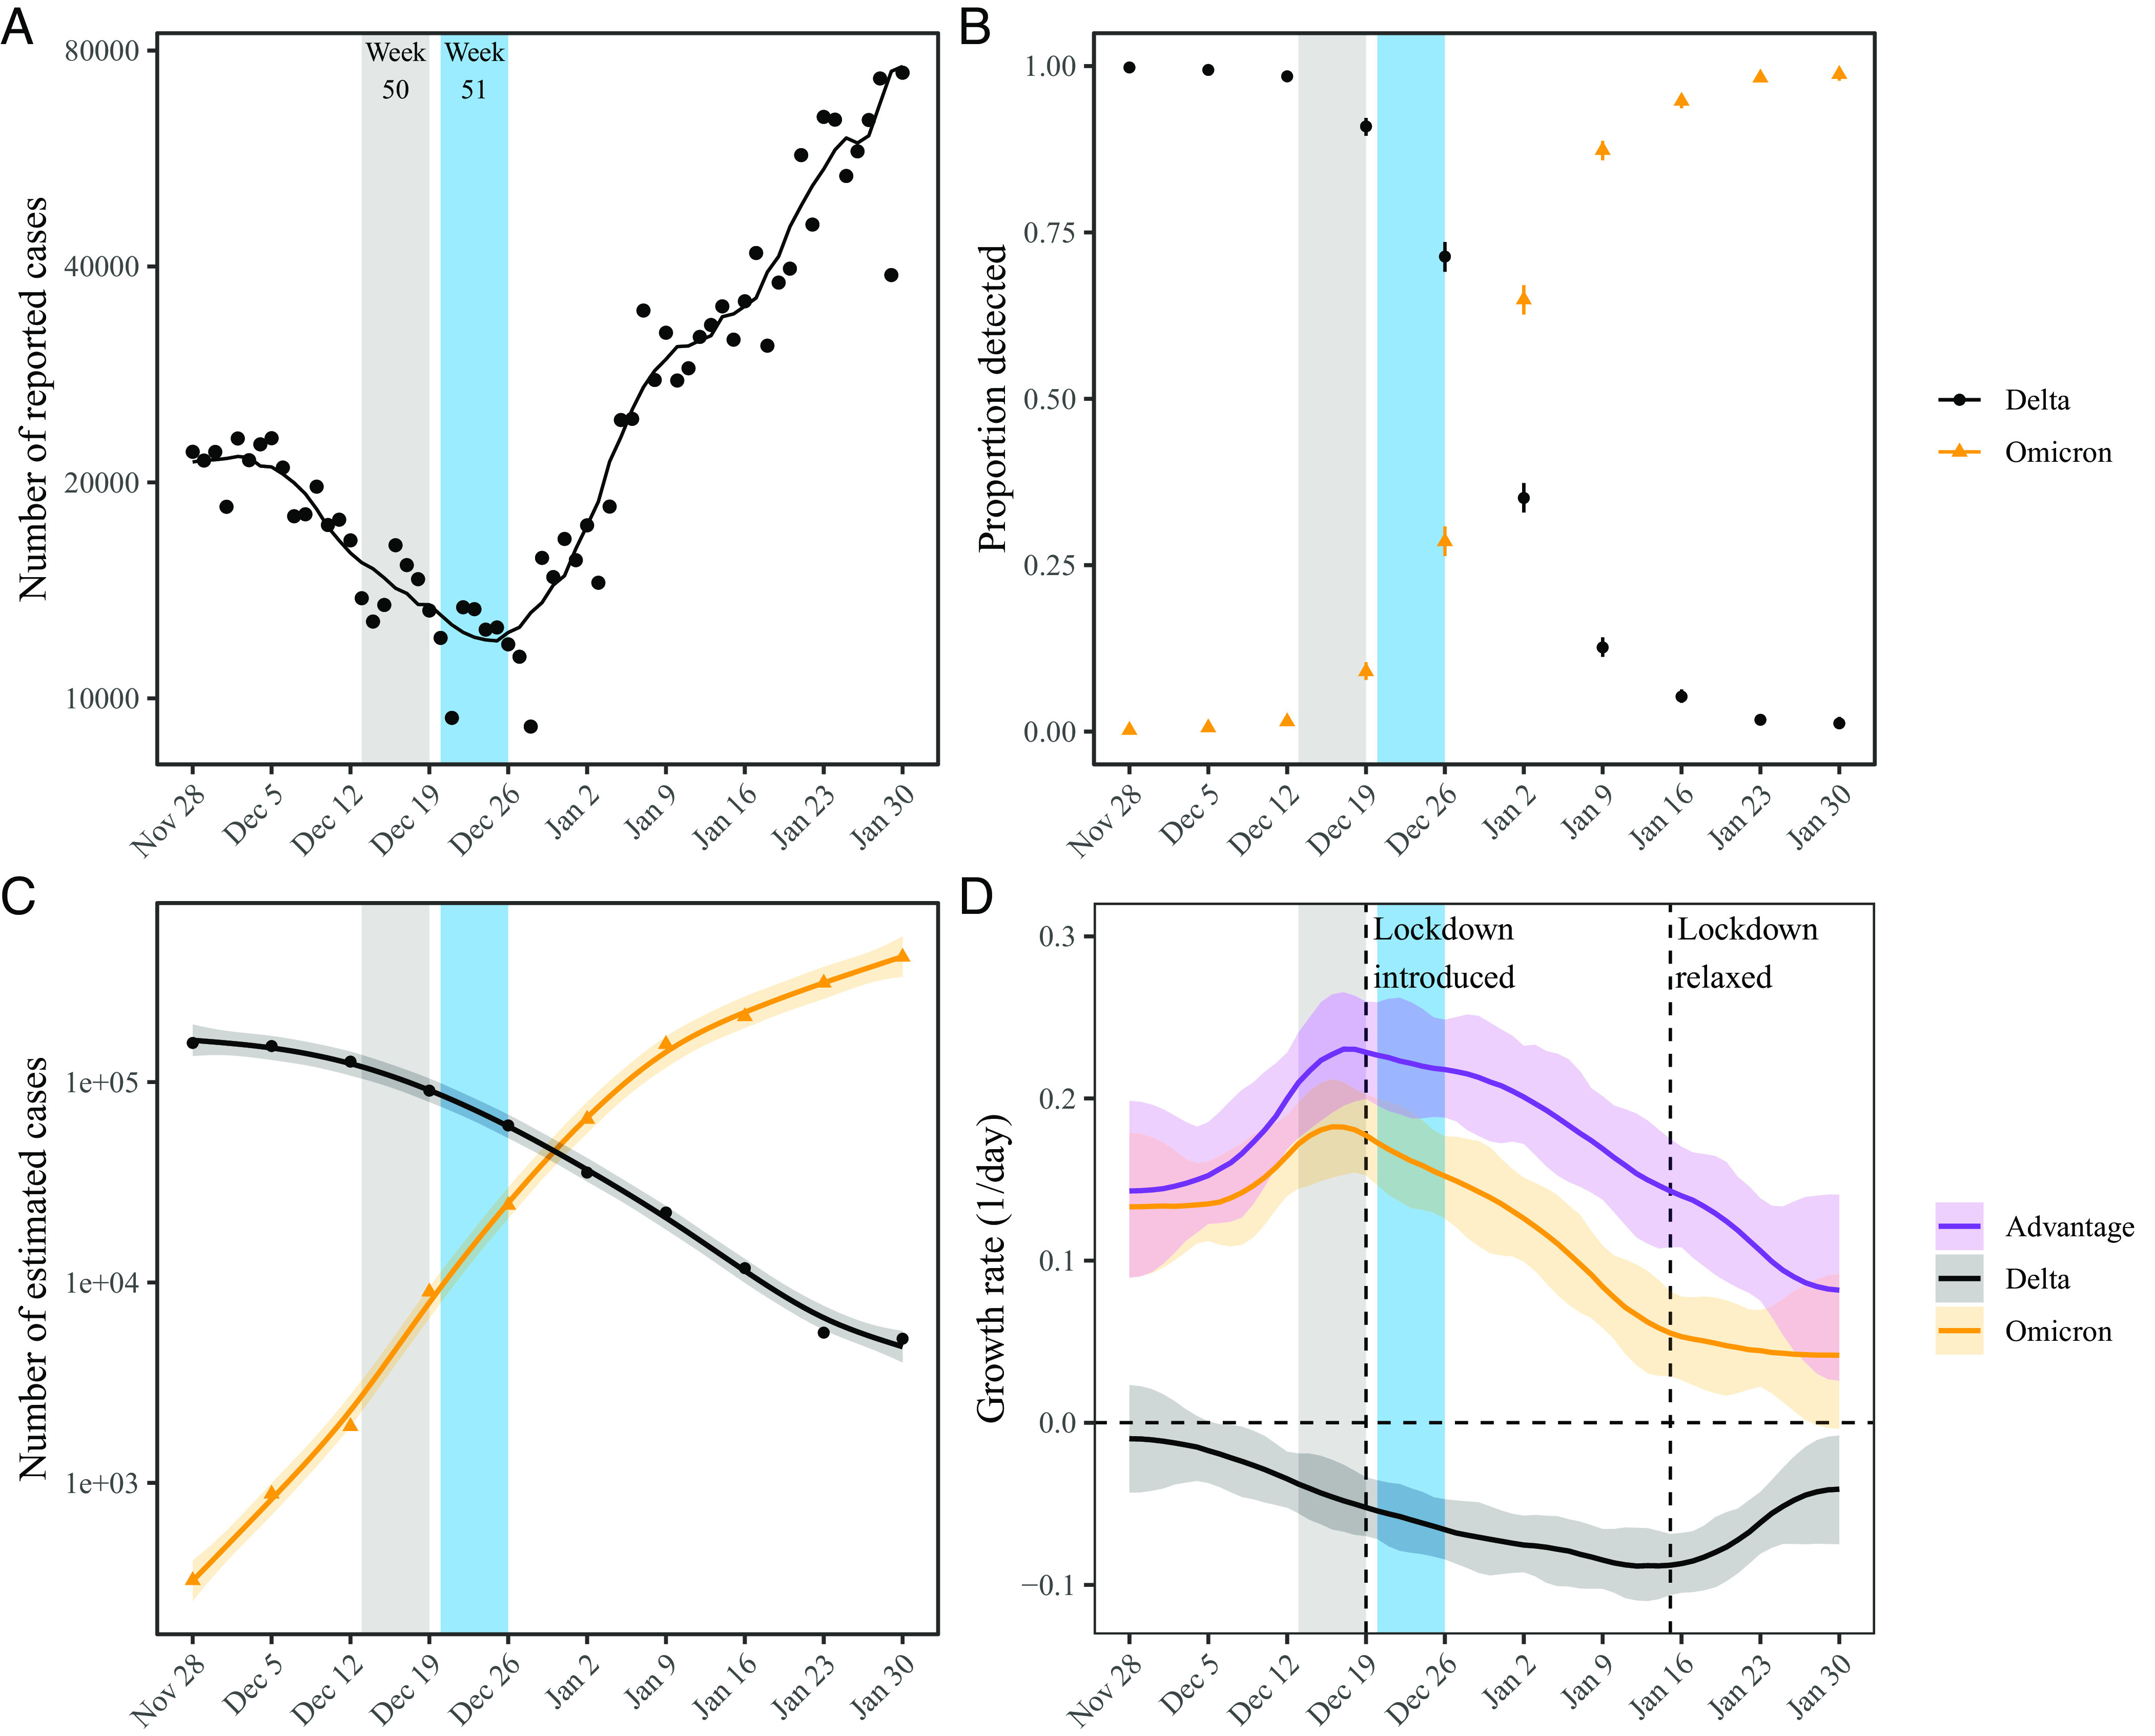
Fig. 2.

Epidemic dynamics of the Delta and Omicron variants in the Netherlands between November 2021 and January 2022. (A) Daily numbers of reported COVID-19 cases in the Netherlands (points). The solid line represents the 7-d moving average. Data are publicly available at https://data.rivm.nl/covid-19/. (B) Proportion of SARS-CoV-2 variants detected from the Netherlands. Data are publicly available at https://www.rivm.nl/coronavirus-covid-19/virus/varianten. (C) Weekly numbers of COVID-19 cases infected with the Delta (black points) and Omicron (orange triangles) variants are estimated by multiplying the weekly numbers of cases (A) with the proportion of each variant (B). Solid lines and shaded areas represent fitted lines and corresponding 95% confidence intervals using a generalized additive model. (D) Estimated growth rates of the Delta (black) and Omicron variants (orange) and their growth-rate differences (purple). Lines and shaded areas represent medians and corresponding 95% confidence intervals. Growth rates are estimated by taking the derivative of the generalized additive model estimates of the logged number of cases.
