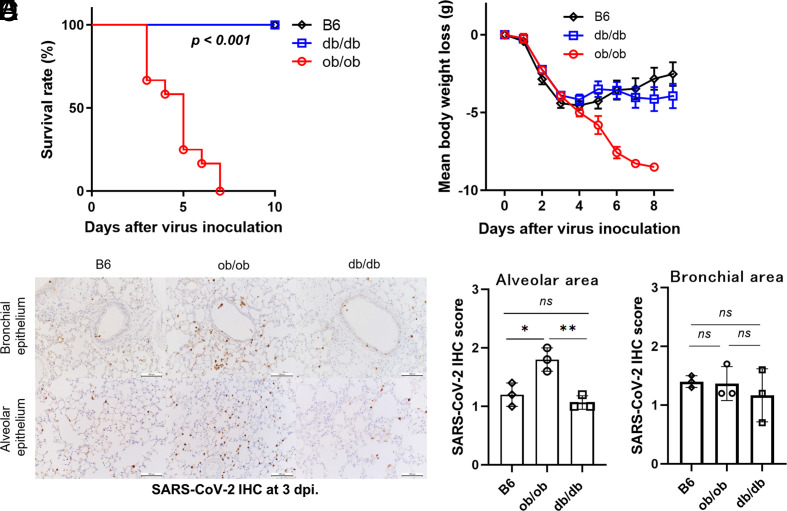
Fig. 2.
ob/ob mice were more vulnerable to SARS-CoV-2 infection with high infectivity. (A and B) Survival curve (A) and body weight (B) of ob/ob, db/db, and B6 mice (n = 11 to 12) after mouse-adapted SARS-CoV-2 inoculation. Data are pooled from two independent experiments showing similar results. Log-rank (Mantel–Cox) test was used to assess the survival curve. Data are mean ± SE. (C–E) Immunohistochemical staining using anti-SARS-CoV-2 N-specific antibody in the lungs of three strains at three days postinfection (dpi) in alveolar area (D) and bronchial area (E). (Scale bars were 100 µm.) Data are presented as the mean ± SD, *P < 0.05, **P < 0.01, ***P < 0.001. Data were analyzed by one-way ANOVA followed by Tukey’s post hoc test.

