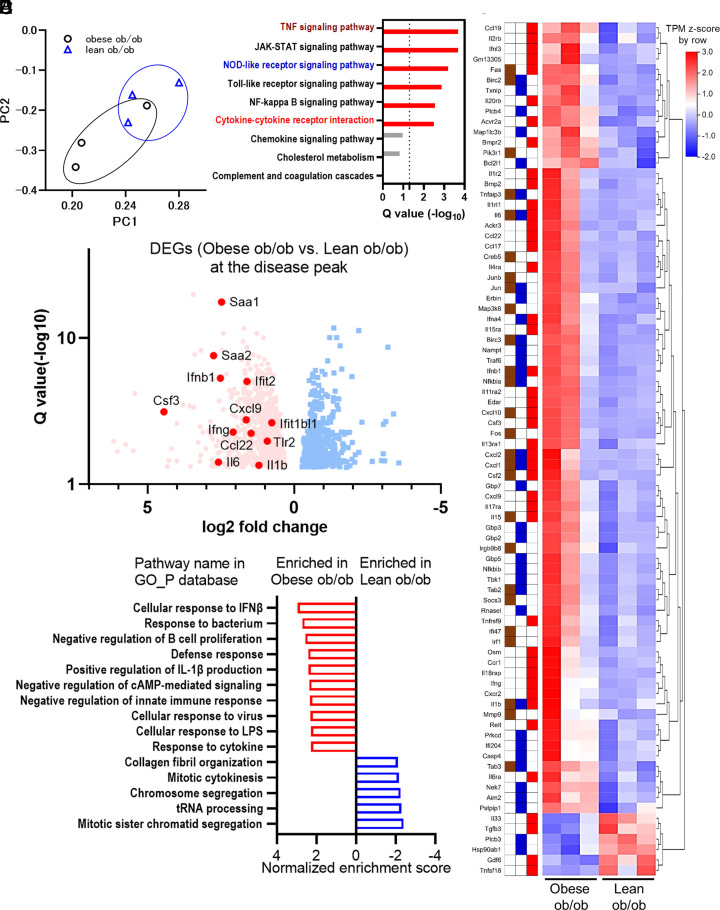
Fig. 6.
Excessive immune responses observed in the obese ob/ob mice were attenuated in lean ob/ob mice under SARS-CoV-2 infection. (A–E) RNA sequencing analysis comparing the immune responses of obese ob/ob mice to lean ob/ob mice at three days postinfection (dpi). Obese ob/ob mice and lean ob/ob mice were continuously administrated with vehicle or 2 µg/day of leptin using ALZET pump for 6 wk. (A) Principal component analysis from six murine lung samples; obese ob/ob, n = 3 and lean ob/ob, n = 3. (B) KEGG enrichment analysis of the 1,615 DEGs in obese ob/ob vs. lean ob/ob mice. Nine representative pathways (Q < 0.05 in Fig. 4C) were shown. The colors of the pathway name were the same as those of Fig. 4C. (C) The heatmap of representative gene transcriptions categorized in TNF signaling pathway, NOD-like receptor signaling pathway, or cytokine–cytokine receptor interaction pathway in the 1,615 DEGs. The tiles next to the gene name indicate their categorized pathways: TNF signaling pathway, NOD-like receptor signaling pathway, and cytokine–cytokine receptor interaction pathway are shown in brown, dark blue, and red, respectively. The Transcripts Per Kilobase Million (TPM) Z-scores were standardized by row direction. (D) Volcano plot of DEGs in obese ob/ob vs. lean ob/ob mice. Red dot and blue dot indicate individual DEGs elevated in obese ob/ob mice or lean ob/ob mice, respectively. Representative gene names are shown, including inflammatory cytokines, chemokines, type I interferon downstream genes, and acute-phase reactants. (E) The representative results of gene set enrichment analysis comparing obese ob/ob mice vs. lean ob/ob mice using the gene ontology (GO) database related to biological process (GO_P).

