Fig. 2.
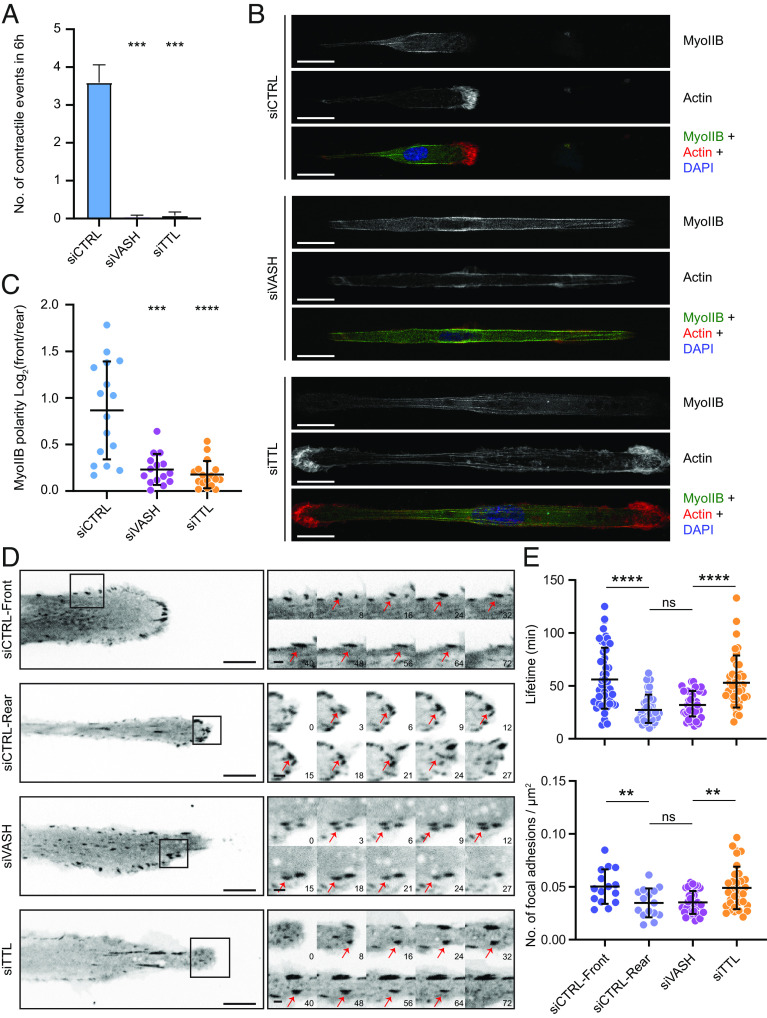
Microtubule detyrosination regulates cell contractility and focal adhesion dynamics. (A) Analysis of the number of contractile events in RPE-1 cells treated with indicated siRNAs migrating on 5-µm linear micropatterns. Error bars represent SD. (N, n): siCTRL (37,4), siVASH (69,4), and siTTL (46,4). (B) Representative point-scanning confocal maximum-intensity projected images of RPE-1 cells on linear micropatterns subject to indicated treatments immunostained with antibody against myosin-IIB (Myo-IIB) and phalloidin for actin with DAPI as a DNA counterstain. (Scale bar, 20 µm.) (C) Quantification of Myo-IIB intensity polarity on the two sides from RPE-1 cells transfected with respective siRNAs. (N, n): siCTRL (16,2), siVASH (15,2), and siTTL (17,2). (D) Representative spinning-disk confocal time-series images of focal adhesion assembly and disassembly dynamics from RPE-1 cells on linear micropatterns, stably expressing GFP-vinculin treated with indicated siRNAs. Sequential magnified view of the marked area with red arrows marking focal adhesion lifecycle from their assembly to disassembly. (Scale bar: 10 μm; zoomed images scale bar: 2 μm.) Time in min. (E) Quantification of lifetime and number of focal adhesions following indicated treatments. Lifetime of individual focal adhesions and number of focal adhesions on each side of the RPE-1 cells from four independent experiments are plotted (number of focal adhesions, number of cells): Lifetime—siCTRL (47,14), siVASH (42,15), and siTTL (39,13); number of focal adhesions—siCTRL (168,15), siVASH (340,17), and siTTL (240,17). N, number of cells; n, number of independent experiments. The scatter plots include mean ± SD. ns, not significant; **P ≤ 0.01, ***P ≤ 0.001, and ****P ≤ 0.0001.

