
Fig. 5.
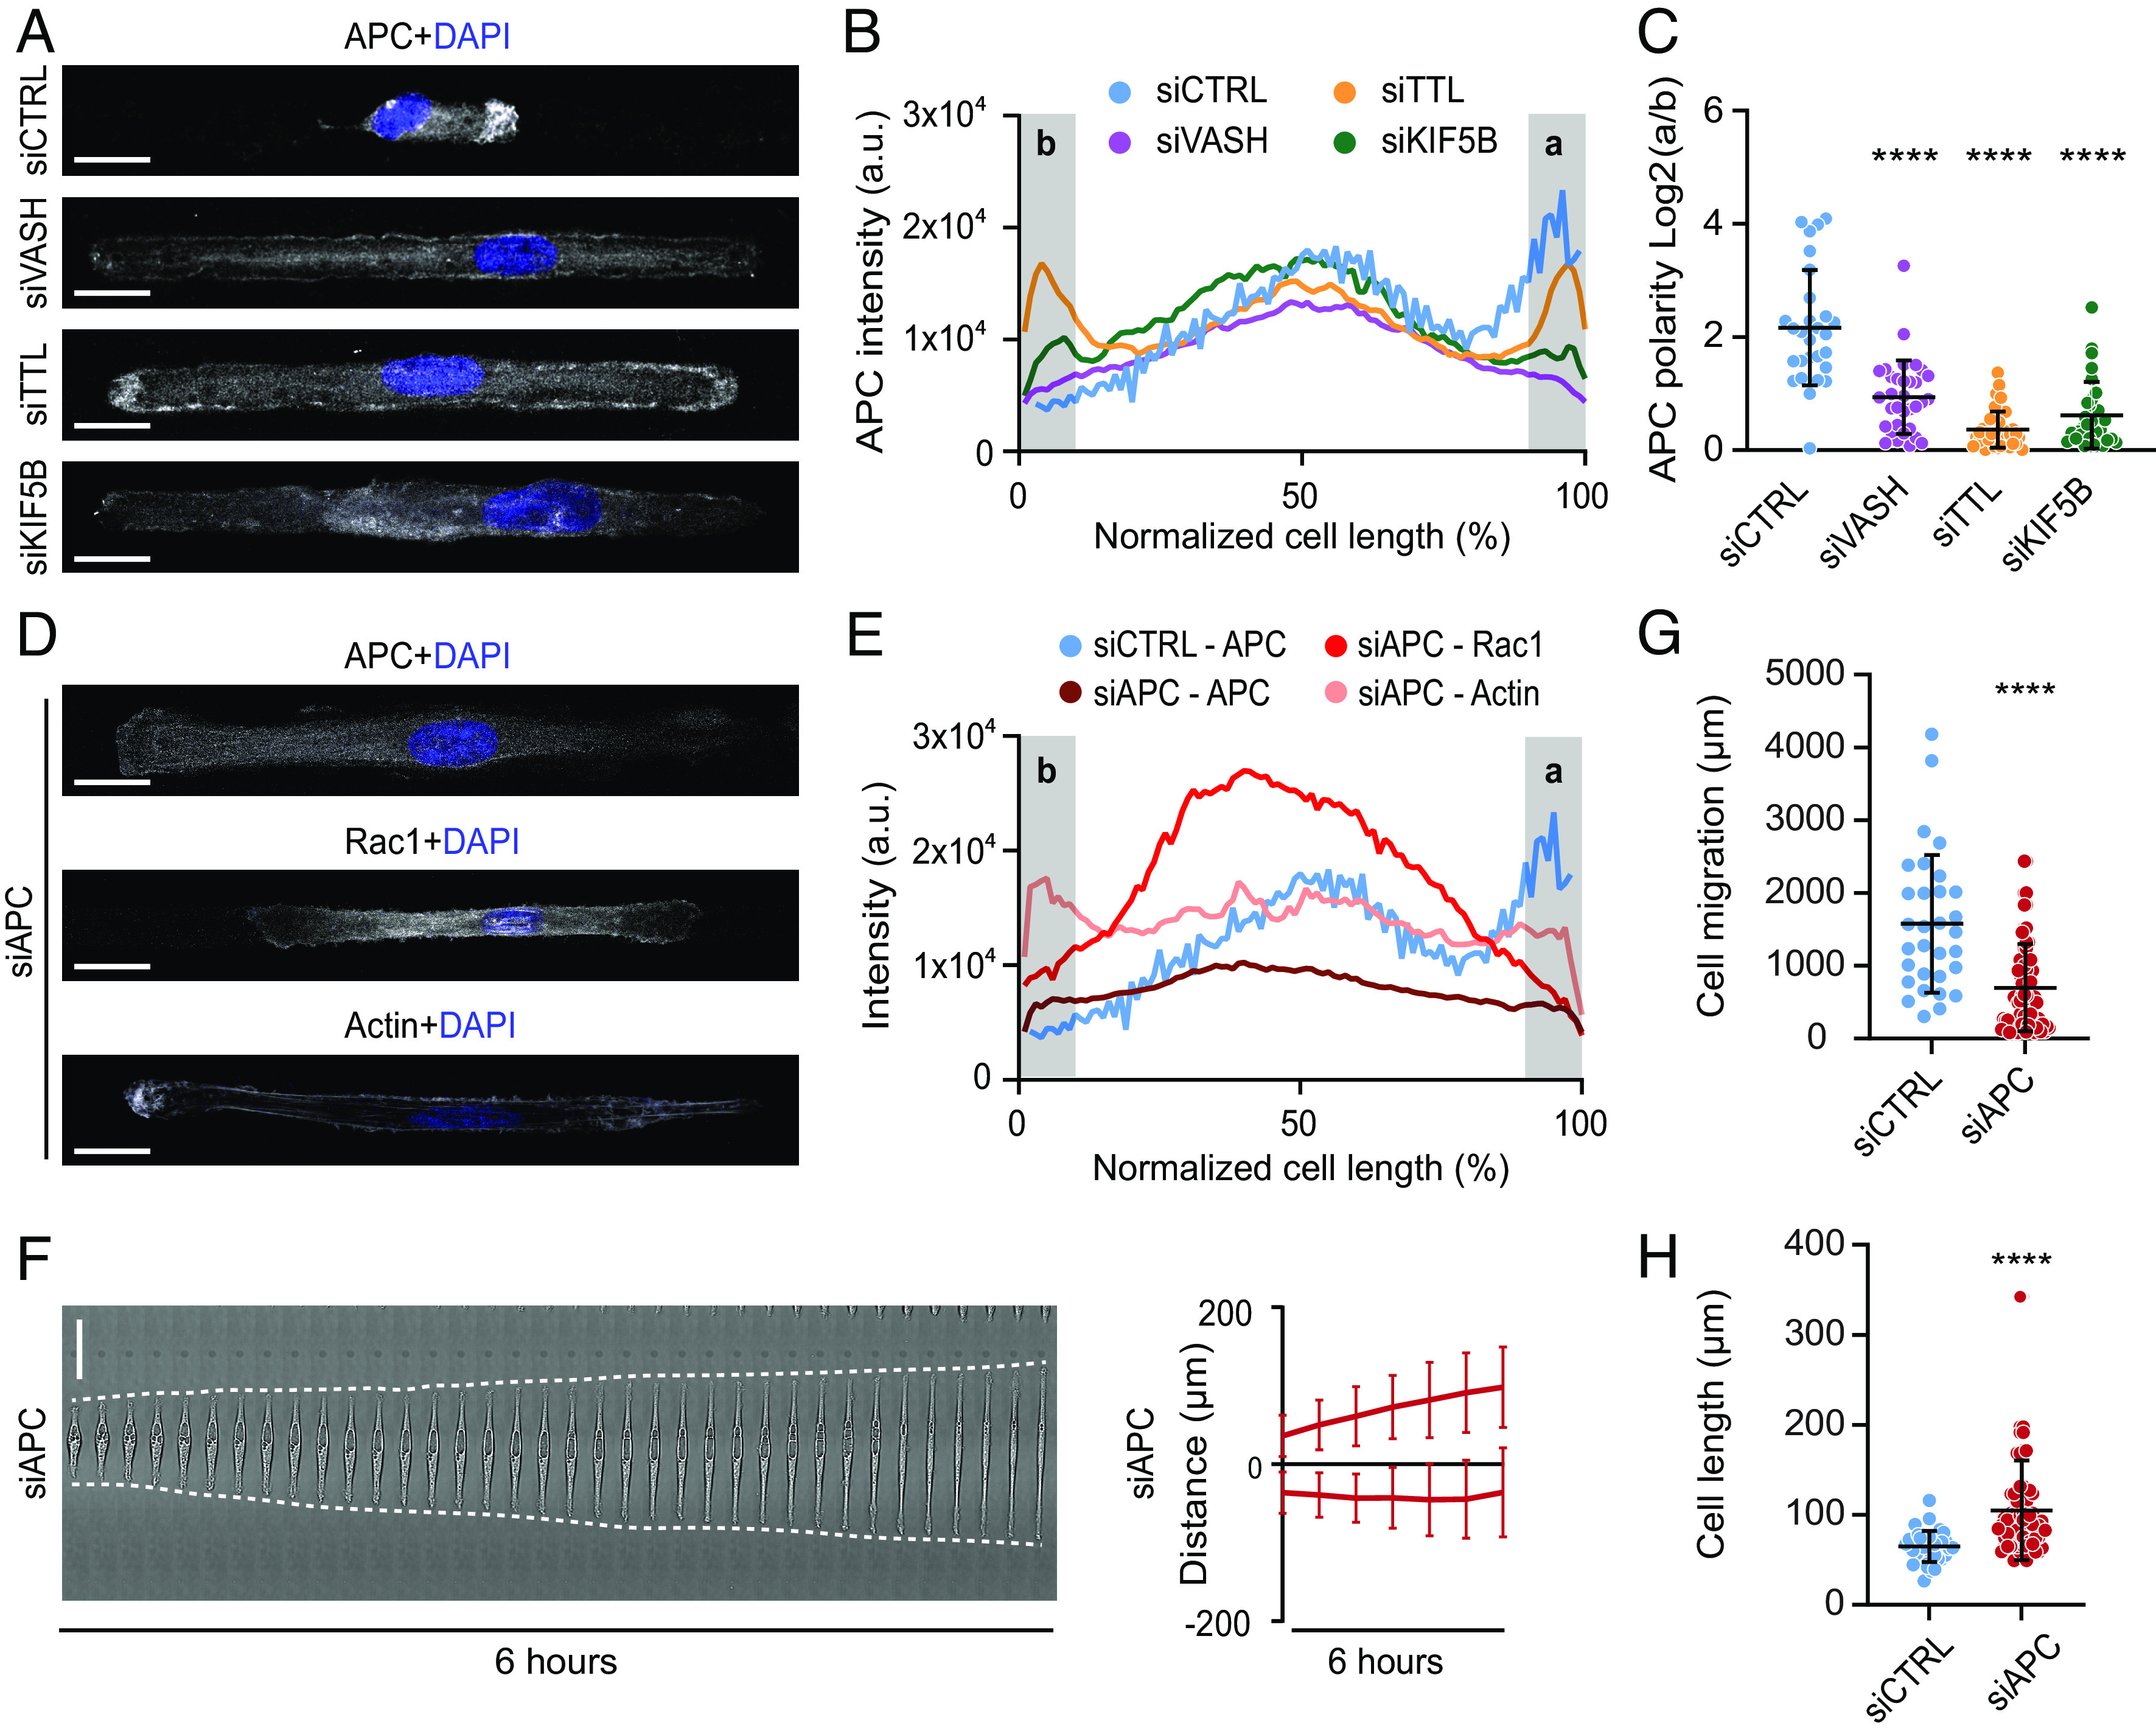
Microtubule detyrosination regulates kinesin-1-based intracellular transport of APC to initiate symmetry breaking required for directed cell migration. (A) Representative maximum-intensity projected confocal images of RPE-1 cells on linear micropatterns following indicated treatments immunostained with anti-APC antibody. DAPI serves as a nuclear stain. (Scale bar, 20 µm.) (B) Mean line scan profiles of APC intensities in RPE-1 cells treated with indicated siRNAs. The shaded area (a, b) represents 10% of normalized area of the edges of the two sides. (C) Quantification of APC intensity polarity at the cell edges (a/b) from immunostained RPE-1 cells transfected with respective siRNAs. (N, n): siCTRL (28,3), siVASH (33,3), siTTL (42,3), and siKIF5B (31,3). (D) Representative maximum-intensity projected confocal images of RPE-1 cells on linear micropatterns following siRNA-mediated knockdown of APC immunostained with anti-APC, anti-Rac1 antibodies, and phalloidin-stained actin. DNA was counterstained with DAPI. (Scale bar, 20 µm.) (E) Mean line scan profiles of specified intensities in RPE-1 cells treated APC-specific siRNA. The shaded area (a, b) represents 10% of normalized area of the edges of the two sides. (F) Representative kymograph of APC-depleted RPE-1 cell migration on 5-µm linear micropatterns. White dotted lines follow the edges of the cell. The combined kymograph trajectories with mean ± SD are shown on the Right. (Scale bar, 50 µm.) (N, n): siAPC (35,4). (G and H) Scatter plot of total cell migration distance (G) and cell length (H) of siAPC-treated RPE-1 cells after 6 h on 5-µm linear micropatterns. (N, n): Cell migration—siCTRL (31,4) and siAPC (70,4); cell length—siCTRL (39,4) and siAPC (70,4). N, number of cells, n, number of independent experiments. The scatter plots include mean ± SD. ****P ≤ 0.0001.