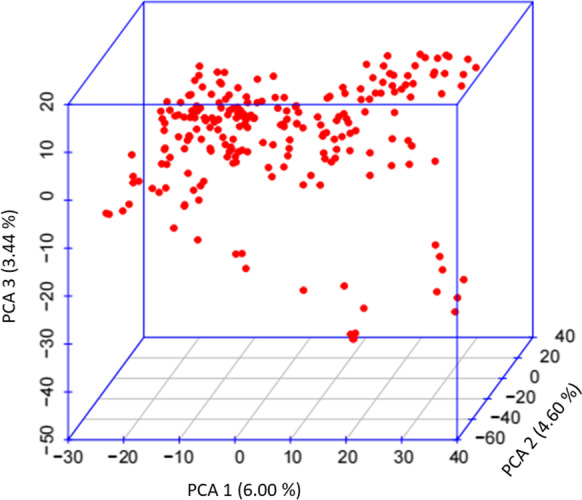
Fig. 2.

3D scatter plot (3D PCA) of 225 SWRS genotypes based on the first three principal components (PC1, PC2 and PC3). The horizontal and vertical coordinates represent PC1 (with variance explained 6.0%), PC2 (with variance explained 4.60%) and PC3 (with variance explained 3.44%). Each dot represents a genotype
