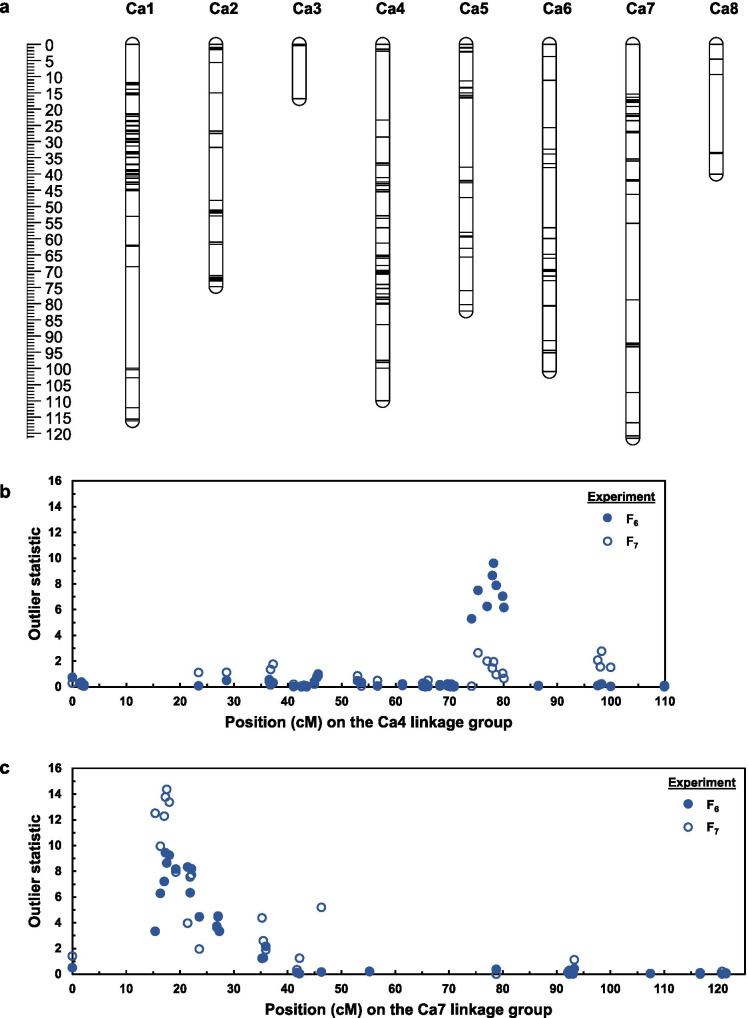
Fig. 3.
Linkage map (a) for a PBA HatTrick Kyabra chickpea population and outlier statistics for the association of marker positions on the Ca4 (b) and Ca7 (c) chromosomes with log-transformed numbers of Pratylenchus thornei per kg of soil and roots, as evaluated in the F6 generation in 2018 (dark symbols) and the F7 generation in 2019 (white symbols). In panel a, the horizontal lines on the linkage groups represent positions at which genotyping-by-sequencing tag pairs were mapped and the scale bar on the left shows genetic distances in cM

