. 2023 Apr 11;11(6):707–719. doi: 10.1158/2326-6066.CIR-22-0487

Figure 3.

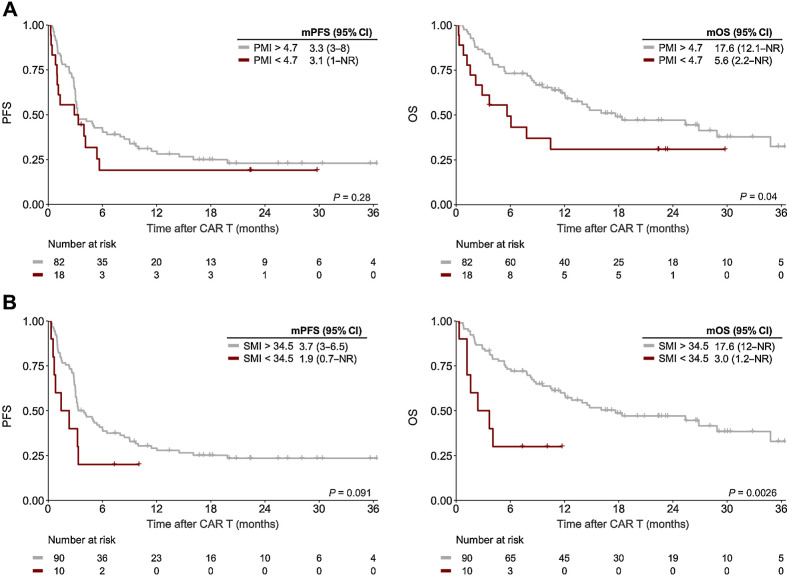
Figure 3. Sarcopenia negatively influences post CD19.CAR-T survival outcomes. Kaplan–Meier estimates of median PFS (left) and OS (right) stratified by PMI (A) and SMI (B). The respective cutoff for each parameter and median survival in months is depicted above the graph. The P value of the Mantel–Cox log-rank test is denoted on the graph inset.

Sarcopenia negatively influences post CD19.CAR-T survival outcomes. Kaplan–Meier estimates of median PFS (left) and OS (right) stratified by PMI (A) and SMI (B). The respective cutoff for each parameter and median survival in months is depicted above the graph. The P value of the Mantel–Cox log-rank test is denoted on the graph inset.