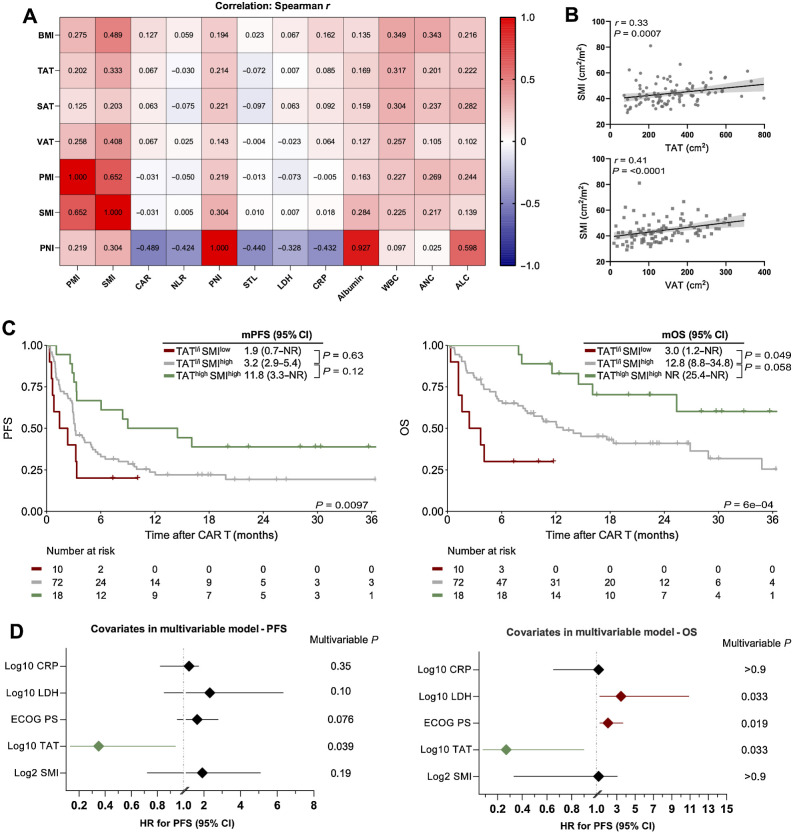
Figure 5.
The combination of increased abdominal adipose and muscle tissue is associated with excellent survival outcomes after CD19.CAR-T. A, A heat map displaying the correlation between body composition parameters, immuno-nutritional scores, and CAR-T risk factors. The Spearman correlation coefficient r is represented within the respective squares. B, Correlation between TAT and VAT with the amount of skeletal muscle measured by SMI. C, Kaplan–Meier estimates of median PFS (left) and OS (right) stratified by the combination of TAT and SMI. TAT low-intermediate (l/i) was defined as <464 cm² and SMI low was defined as <34.5 cm². The respective median survival in months is depicted above the graph. The P value of the Mantel–Cox log-rank test is denoted on the graph inset. D, Forest plots depicting multivariable Cox regression for PFS (left) and OS (right). Adjusted P values accounting for the respective covariates are displayed on the graph inset. Variables reaching statistical significant (P < 0.05) are highlighted in red (increased HR for poor survival) or green (decreased HR for poor survival). WBC, white blood cell count; ANC, absolute neutrophil count; ALC, absolute lymphocyte count.

