. 2023 Mar 9;13(6):1408–1427. doi: 10.1158/2159-8290.CD-22-0939

Figure 4.

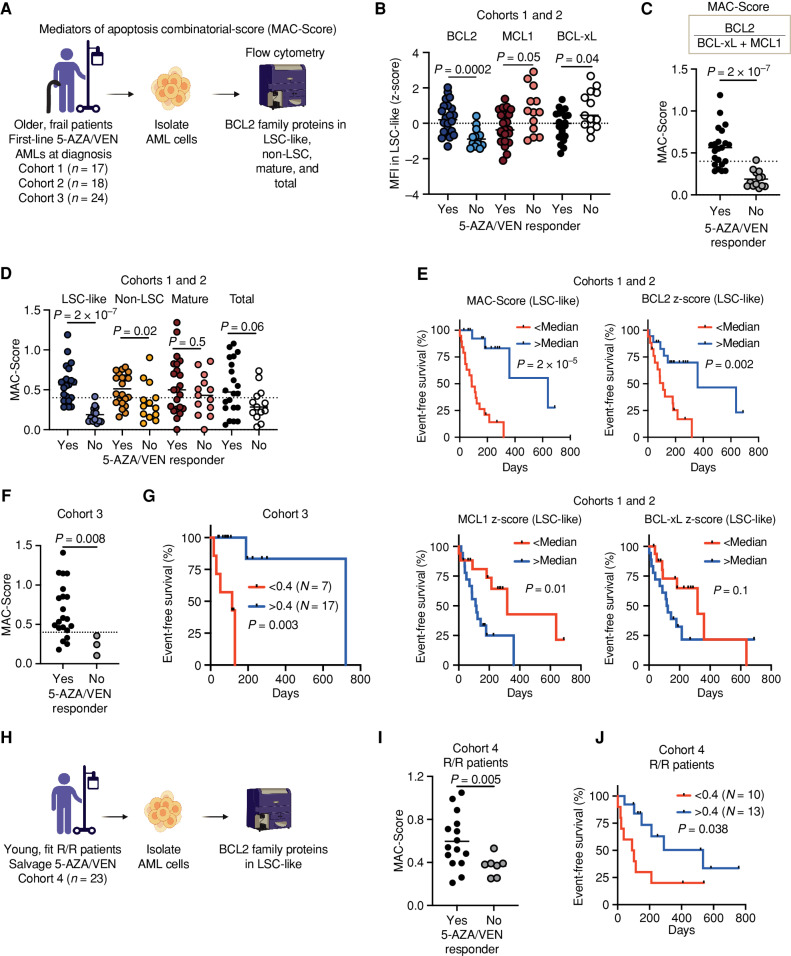
Figure 4. Response to 5-AZA/VEN therapy in patients with AML can be predicted by MAC scoring in LSC-like cells. A, Schematic representation of the experimental design for B–G. Mononuclear cells of AML patient samples treated first-line with 5-AZA/VEN from three independently processed cohorts (cohort 1: n = 17, cohort 2: n = 18, and vohort 3: n = 24) were stained with surface antibodies, followed by intracellular staining of three BCL2 family proteins. MAC-Score was calculated based on normalized BCL2 family protein expression levels in LSC-like, non-LSC, mature, and total blast cells. B, Expression of BCL2, MCL1, and BCL-xL in LSC-like cells of patients with AML from cohorts 1 and 2 combined and associated 5-AZA/VEN therapy outcome. Protein expression is shown as MFI z-scores. C, MAC-Score in LSC-like cells of patients with AML from cohorts 1 and 2 combined and association to 5-AZA/VEN therapy outcome. D, Comparison of MAC-Score in LSC-like, non-LSC, mature, and total blast cells of patients with AML from cohorts 1 and 2 and association to 5-AZA/VEN therapy outcome. E, EFS of first-line 5-AZA/VEN AML patients from cohorts 1 and 2 combined with above and below median MAC-Score, BCL2 expression, MCL1 expression, or BCL-xL expression in LSC-like cells. F, MAC-Score in LSC-like cells of patients with AML from cohort 3 and associated 5-AZA/VEN therapy outcome. G, EFS of first-line 5-AZA/VEN AML patients from cohort 3 with above (>0.4) and below (<0.4) median MAC-Score in LSC-like cells. H, Schematic representation of the experimental design for I–J. Mononuclear cells of patients with relapsed/refractory AML who received 5-AZA/VEN as a salvage therapy (cohort 4: n = 23) were stained with surface antibodies, followed by intracellular staining of BCL2 family proteins. I, MAC-Score in LSC-like cells of patients with AML from cohort 4 and associated 5-AZA/VEN therapy outcome. J, EFS of salvage-treated 5-AZA/VEN AML patients from cohort 4 with above (>0.4) and below (<0.4) median MAC-Score determined in LSC-like cells. Each dot represents an AML patient sample with the line marking the mean unless specified otherwise. Mann–Whitney test was used to compare groups and log-rank test to compare therapy durations of AML patients. R/R, relapsed/refractory to standard induction. Parts of the figure were created with BioRender.com.

Response to 5-AZA/VEN therapy in patients with AML can be predicted by MAC scoring in LSC-like cells. A, Schematic representation of the experimental design for B–G. Mononuclear cells of AML patient samples treated first-line with 5-AZA/VEN from three independently processed cohorts (cohort 1: n = 17, cohort 2: n = 18, and vohort 3: n = 24) were stained with surface antibodies, followed by intracellular staining of three BCL2 family proteins. MAC-Score was calculated based on normalized BCL2 family protein expression levels in LSC-like, non-LSC, mature, and total blast cells. B, Expression of BCL2, MCL1, and BCL-xL in LSC-like cells of patients with AML from cohorts 1 and 2 combined and associated 5-AZA/VEN therapy outcome. Protein expression is shown as MFI z-scores. C, MAC-Score in LSC-like cells of patients with AML from cohorts 1 and 2 combined and association to 5-AZA/VEN therapy outcome. D, Comparison of MAC-Score in LSC-like, non-LSC, mature, and total blast cells of patients with AML from cohorts 1 and 2 and association to 5-AZA/VEN therapy outcome. E, EFS of first-line 5-AZA/VEN AML patients from cohorts 1 and 2 combined with above and below median MAC-Score, BCL2 expression, MCL1 expression, or BCL-xL expression in LSC-like cells. F, MAC-Score in LSC-like cells of patients with AML from cohort 3 and associated 5-AZA/VEN therapy outcome. G, EFS of first-line 5-AZA/VEN AML patients from cohort 3 with above (>0.4) and below (<0.4) median MAC-Score in LSC-like cells. H, Schematic representation of the experimental design for I–J. Mononuclear cells of patients with relapsed/refractory AML who received 5-AZA/VEN as a salvage therapy (cohort 4: n = 23) were stained with surface antibodies, followed by intracellular staining of BCL2 family proteins. I, MAC-Score in LSC-like cells of patients with AML from cohort 4 and associated 5-AZA/VEN therapy outcome. J, EFS of salvage-treated 5-AZA/VEN AML patients from cohort 4 with above (>0.4) and below (<0.4) median MAC-Score determined in LSC-like cells. Each dot represents an AML patient sample with the line marking the mean unless specified otherwise. Mann–Whitney test was used to compare groups and log-rank test to compare therapy durations of AML patients. R/R, relapsed/refractory to standard induction. Parts of the figure were created with BioRender.com.