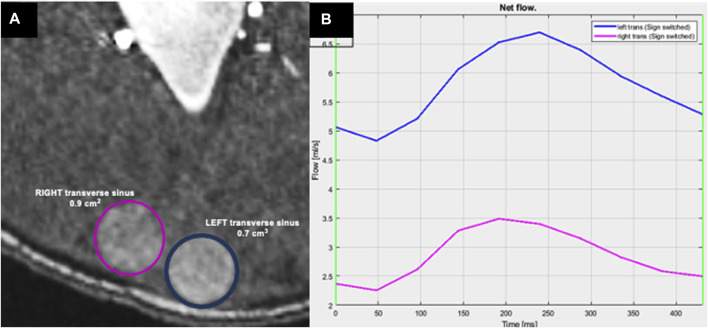
FIGURE 5.
Measurement of flow rate within the transverse sinuses by 2D PCMRI. (A) Axial TOF MRI showing the location of measurements with color corresponding to (B) the plot showing the flow rate at the left (blue) and right (pink) transverse sinuses (division downstream to the confluence of sinuses) as measured by 2DPCMRI. Plot in (B) shows the flow rate over a sampled cardiac cycle, with a higher flow rate through the left transverse sinus at this segment.

