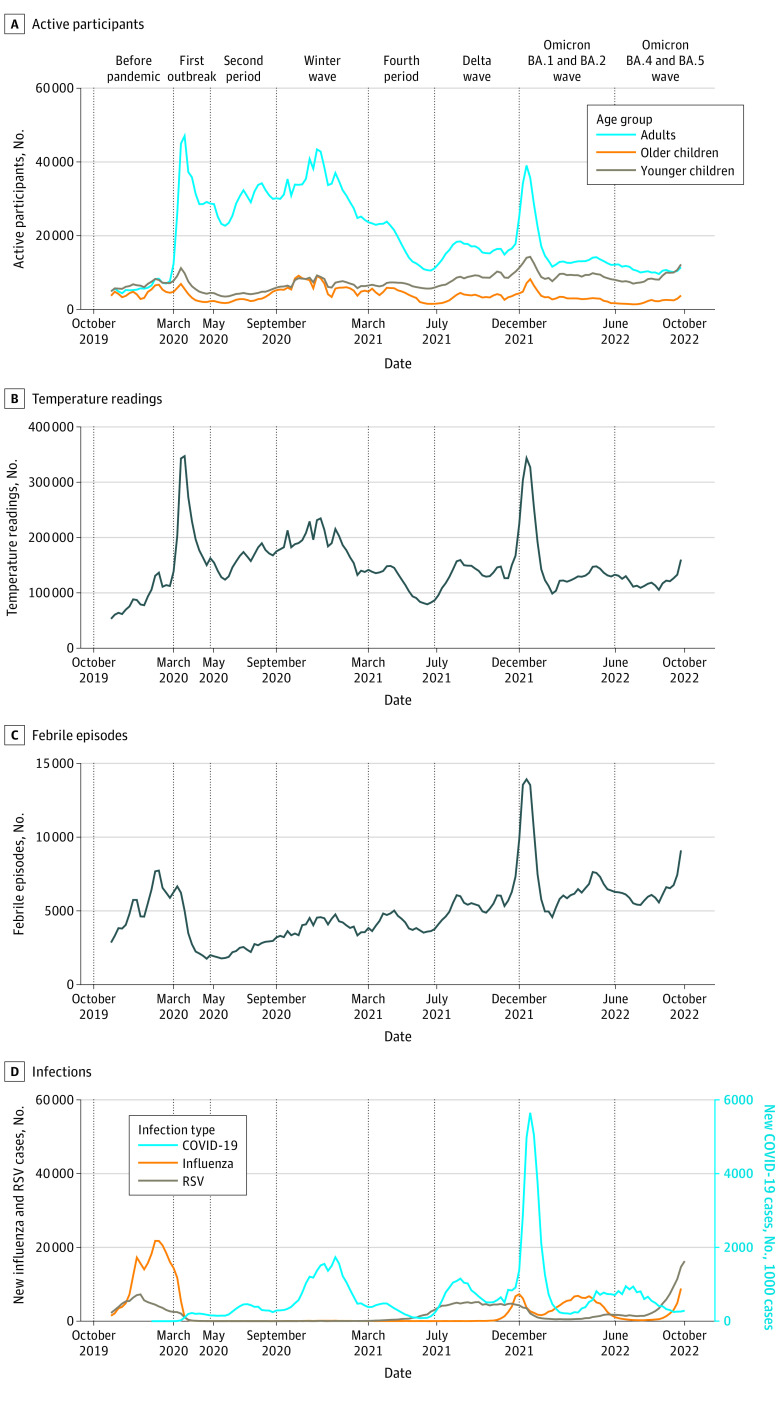
Figure 1. Time Series From Participatory Surveillance Data and Viral Case Rates From Publicly Available Data Sources.
Vertical lines define the beginning of each pandemic period. US COVID-19 case counts in panel D are sourced from the Johns Hopkins University Center for Systems Science and Engineering,22 the number of positive influenza cases from clinical laboratories using FluView Interactive,14 and the number of positive respiratory syncytial virus (RSV) cases from clinical laboratories in the National Respiratory and Enteric Virus Surveillance System (NREVSS).15

