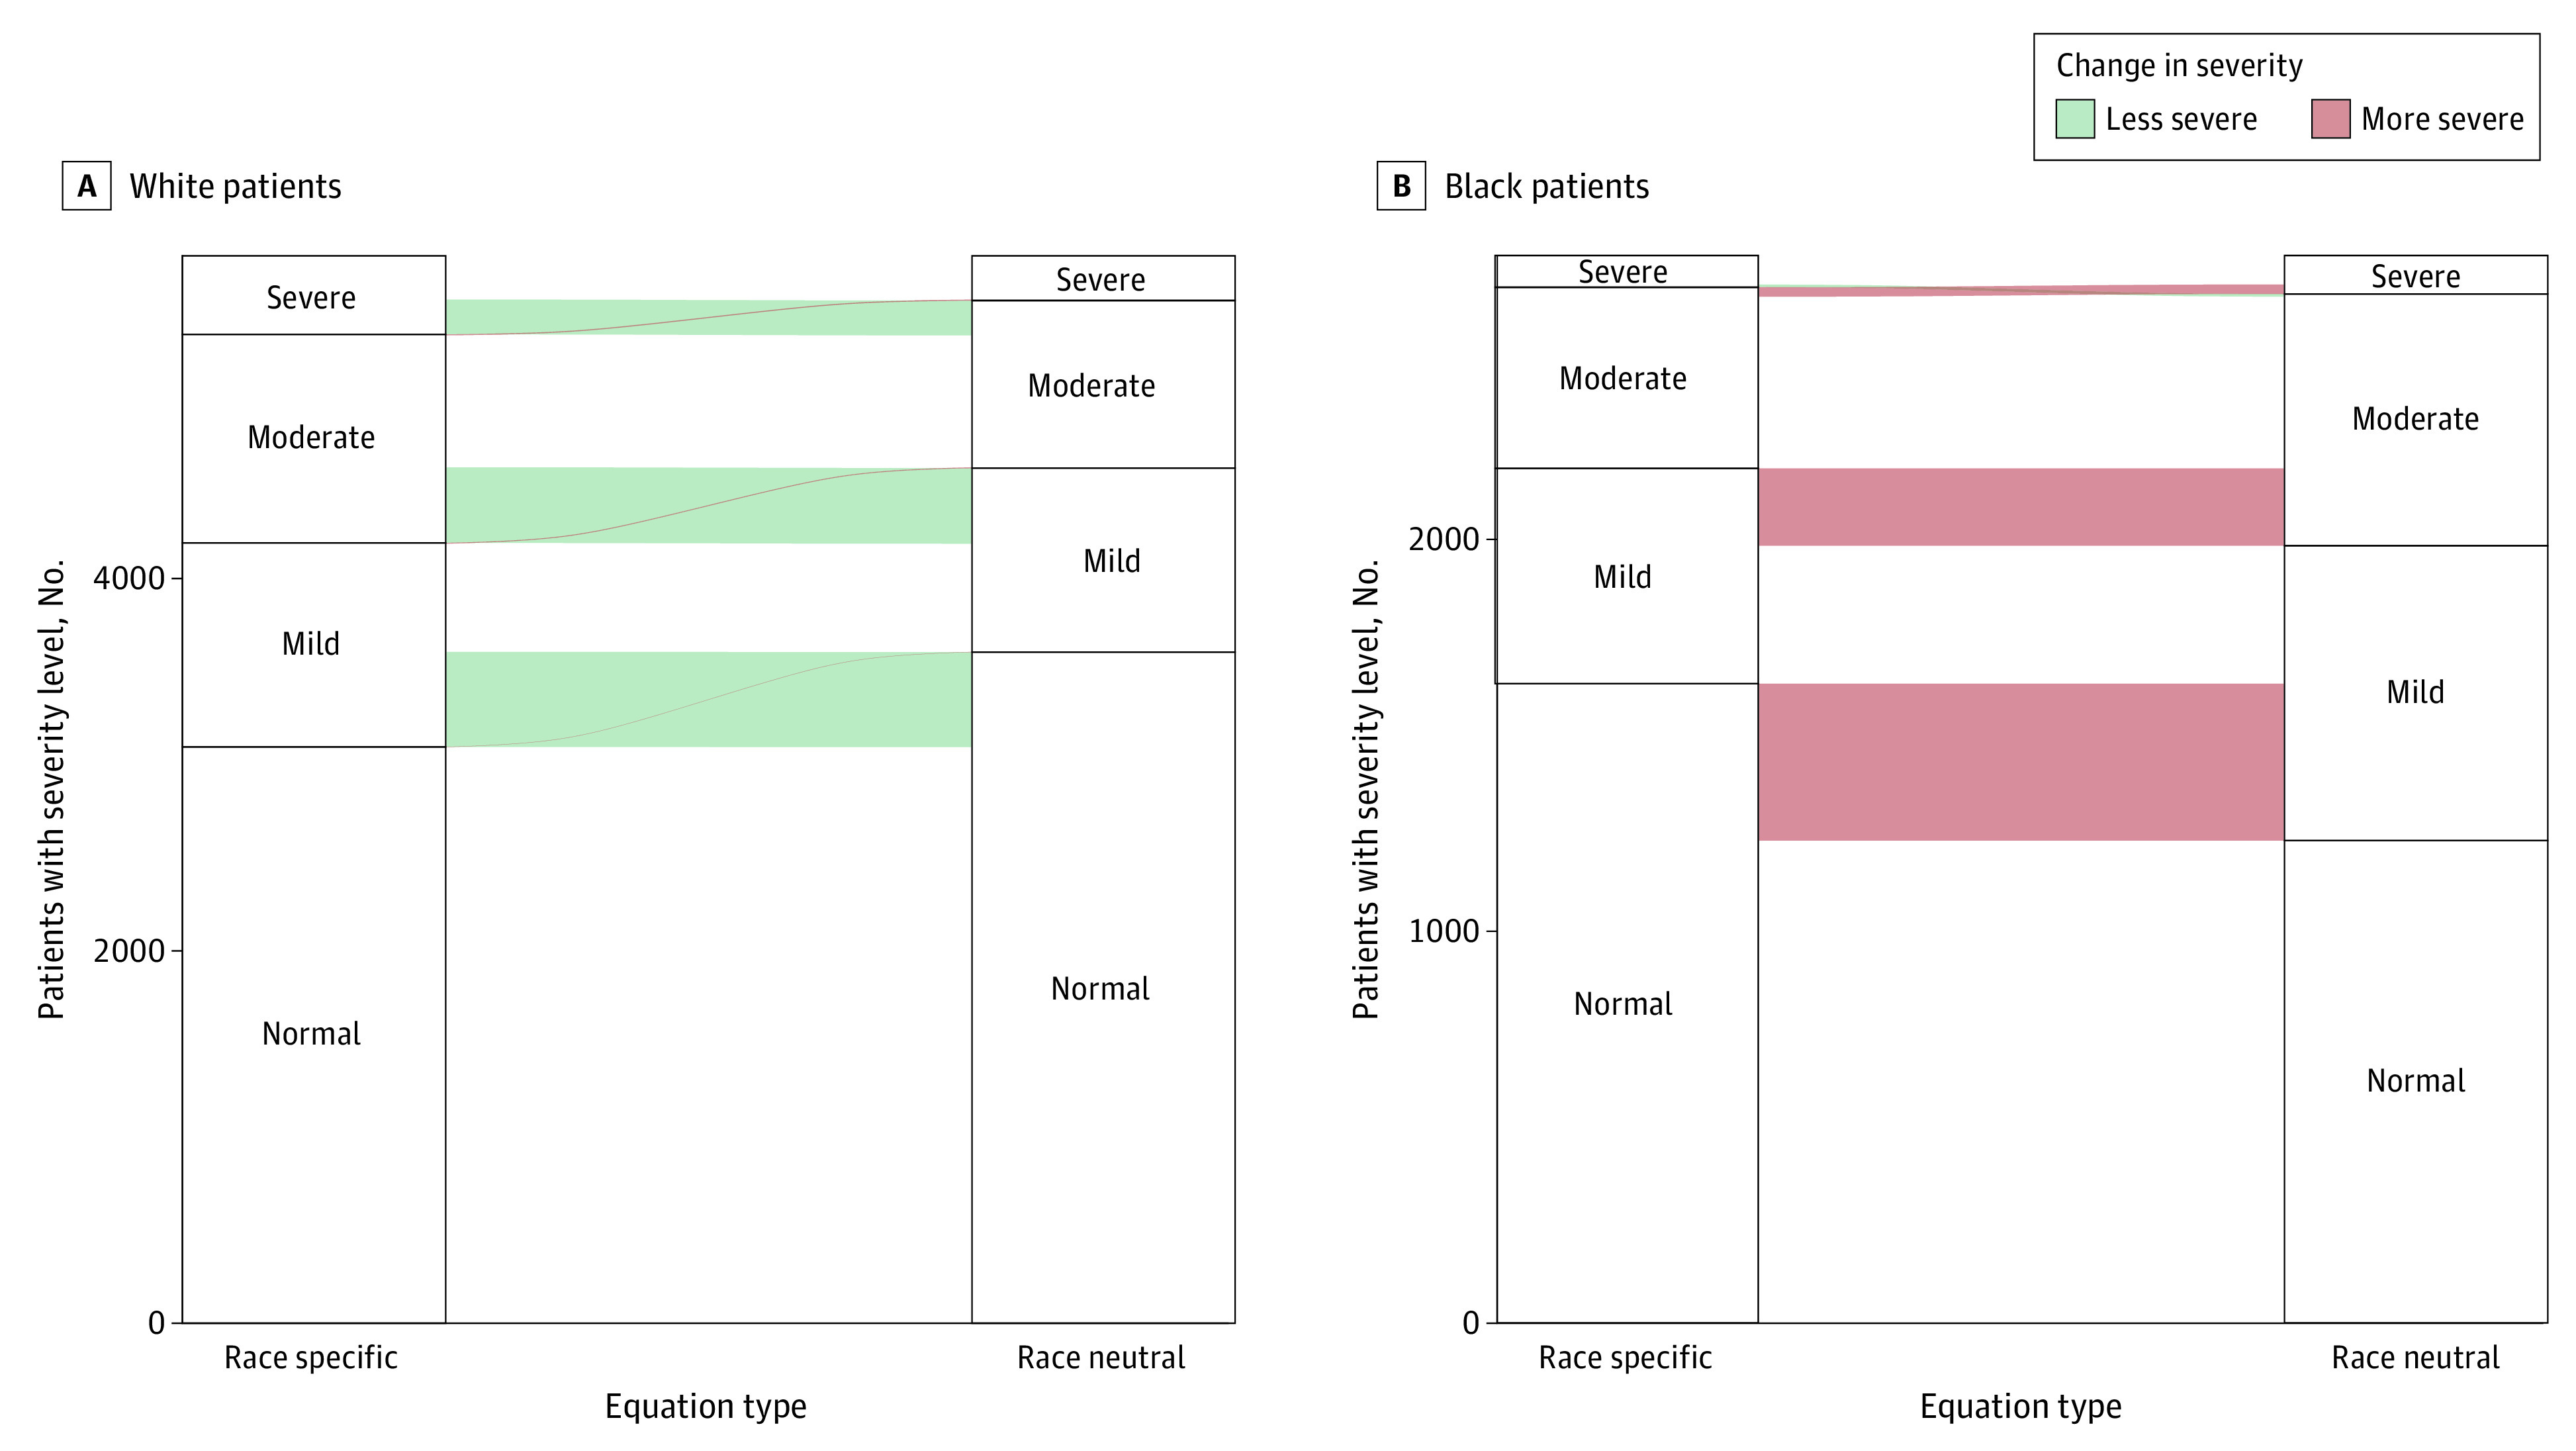
Figure 3. Association of Race-Neutral Reference Equations With the Severity of Lung Function Impairment.

Alluvial plots depict changes in the severity of lung function impairment in White (A) and Black (B) individuals. Strata within each axis represent the number of individuals with severe, moderate, mild, and normal lung function impairments when applying the race-specific 2012 Global Lung Function Initiative reference equations and the race-neutral Global Lung Function Initiative Global reference equations, respectively. Alluvia between axes represent differences in severity between the 2 sets of reference equations. Red alluvia represent a more severe impairment, while green alluvia represent a less severe impairment.
