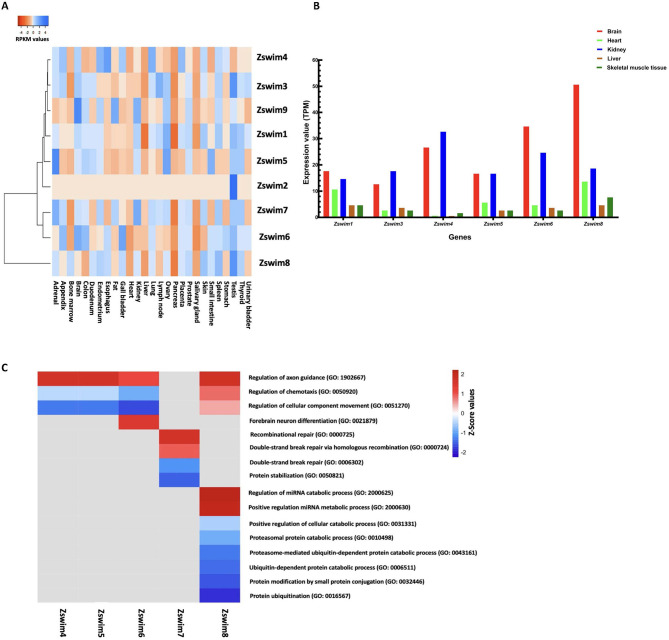
Figure 2.
Expression profiles of ZSWIM genes in human organs and GO analysis
A: Heatmap showing expression profiles of ZSWIM genes in twenty-seven major human organs/tissues. Different colors represent RPKM values, as indicated in the bar at the top of the figure. B: Graphical representation of zswim gene expression profiles in five major organs/tissues in Xenopus. C: Heatmap shows GO terms associated with various biological processes involving ZSWIM family members.

