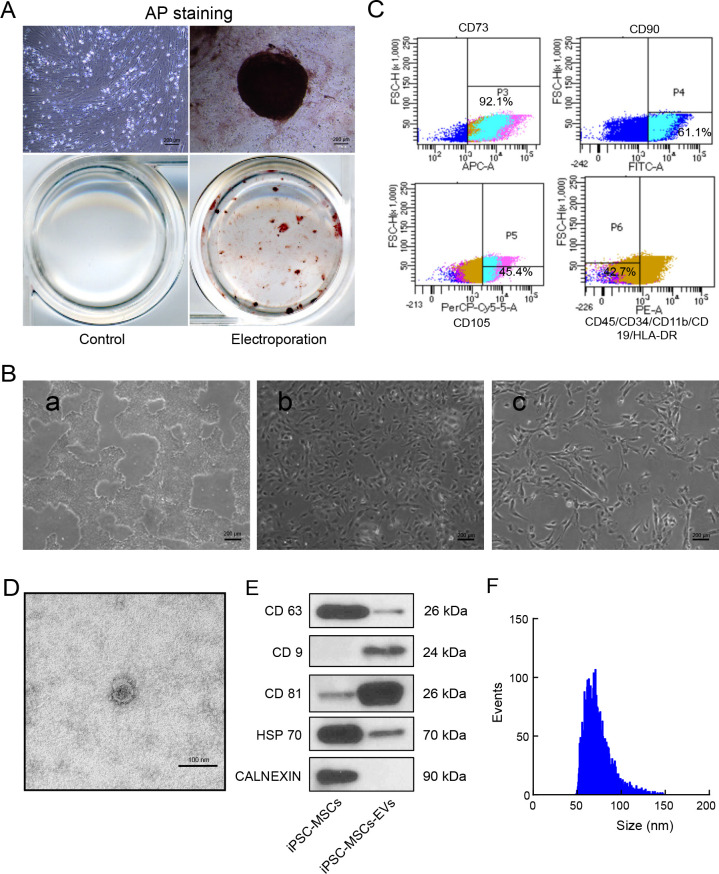
Figure 1.
Characterization of human iPSC-MSCs and iPSC-MSC-EVs
A: iPSCs induced by fibroblasts were positive for AP staining, indicating successful induction of pluripotency. B: Differentiation and characterization of human iPSC-MSCs. Scale bars: 200 μm. a: Representative cell morphology of iPSCs before differentiation; b: Intermediate phase of differentiating iPSCs into MSCs; c: Typical fibroblast-like morphology of cells. C: iPSC-MSCs expressing MSC surface markers CD73, CD90, and CD105 and no negative markers (CD45/CD34/CD11b/CD19/HLA-DR) were sorted and collected by FACS. D: TEM images of iPSC-MSC-EV morphology. Scale bars: 100 nm. E: Western blot analysis of exosome-related markers CD9, CD63, CD81, and HSP70, with CALNEXIN used as a negative control. F: Particle size distribution of iPSC-MSC-EVs determined by flow nanoanalyzer.

