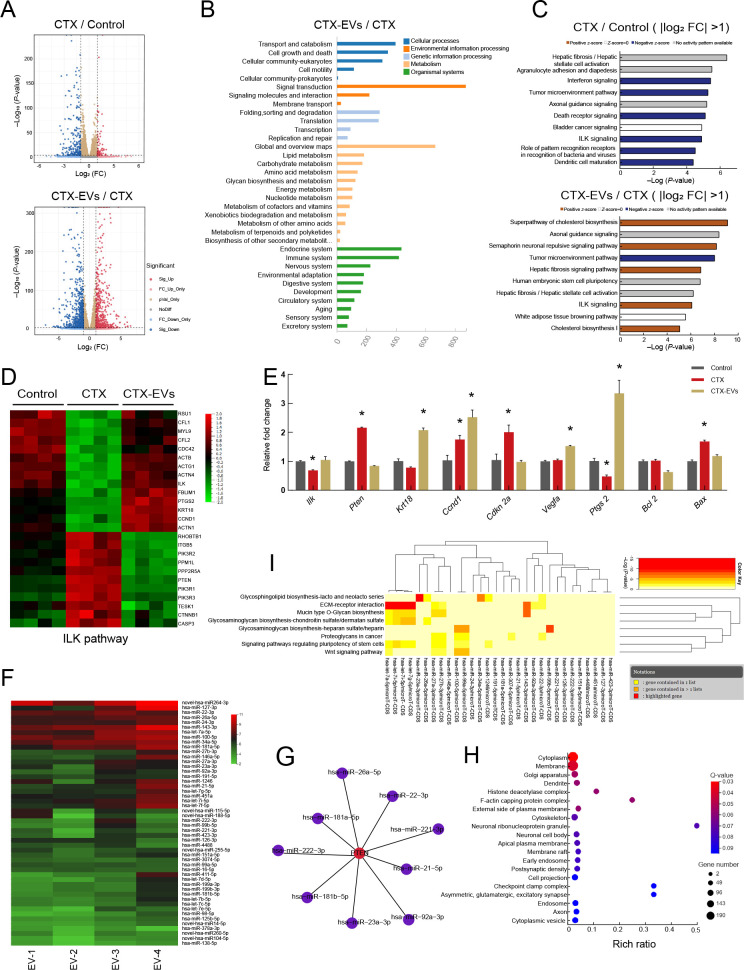
Figure 4.
Analysis of RNA-seq data from granulosa cells and miRNA-seq data from iPSC-MSC-EVs
A: Volcano plots comparing DEGs in different groups. Red points represent up-regulated genes, blue points represent down-regulated genes. |Log2 (fold-change)|=1 and P=0.01 are marked by black broken lines. B: KEGG analysis of genes from five clusters enriched in biological process terms. C: Analysis of DEGs (|log2 fold-change|>1) between CTX and control groups using IPA. Top 10 affected pathways are shown. Analysis of DEGs (|log2 (fold-change)|>1) between CTX-EV and CTX groups using IPA. Top 10 affected pathways are shown. IPA indicated that ILK signaling pathway was down-regulated in CTX-treated group compared to control group. However, ILK signaling pathway was up-regulated in CTX-EV group compared to CTX group. D: Heatmap of relative gene expression levels of DEGs related to ILK pathway. E: qRT-PCR results of expression of ILK pathway-related genes (Ilk, Pten, Krt18, Ccnd1, Cdkn2a, and Vegfa), cumulus expansion-related genes (Ptgs2), and apoptosis marker genes (Bcl2, Bax) in granulosa cells. Data are represented as mean±SD. *: P<0.05. F: Top 50 miRNAs expressed in iPSC-MSC-EVs from biological replicate samples detected by miRNA sequencing. G: Nine of the top 50 miRNAs were predicted to target PTEN by miRWalk and miRTarBase analysis. H: GO enrichment analysis of genes targeted by top 50 miRNAs in iPSC-MSC-EVs. I: Significant KEGG pathways collectively targeted by top 50 miRNAs analyzed by DIANA-miRPath v3.0 (P<0.05). Attached dendrograms on two axes represent hierarchical clustering results for miRNAs and pathways, respectively.

