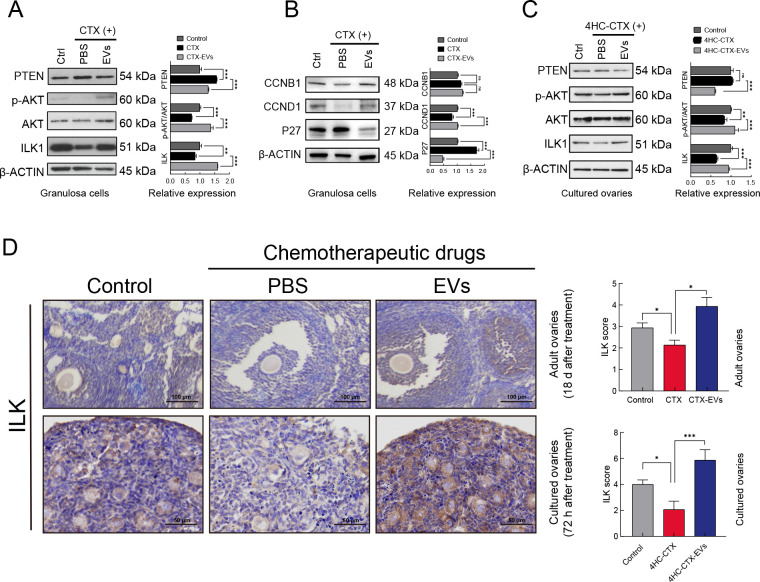
Figure 5.
iPSC-MSC-EVs reversed CTX-induced down-regulation of PTEN/ILK/AKT pathway in in vivo and in vitro
A: Western blot analysis of expression of ILK, AKT, phosphorylated AKT (Ser 473), and PTEN in untreated, CTX (2 mg/mL) treated, and CTX plus iPSC-MSC-EV (20 μg/mL) co-treated granulosa cells. Quantitative protein analysis was performed by ImageJ (right panel). B: Western blot analysis of expression of cell cycle-related proteins CCNB1, CCND1, and P27 in untreated, CTX (2 mg/mL) treated, and CTX plus iPSC-MSC-EV (20 μg/mL) co-treated granulosa cells. Quantitative protein analysis was performed by ImageJ (right panel). C: Western blot analysis of expression of ILK, AKT, phosphorylated AKT (Ser 473), and PTEN in control, 4HC-CTX (10 μmmol/L) treated, and 4HC-CTX plus iPSC-MSC-EV (100 μg/mL) co-treated in vitro-cultured ovaries of mice. Quantitative protein analysis was performed by ImageJ (right panel). D: IHC staining showed that ILK expression was decreased in chemotherapy-treated group but increased after iPSC-MSC-EV transplantation in adult and in vitro-cultured ovaries. IHC staining scores were analyzed statistically (right panel). Scale bar: 200 μm, 50 μm respectively. In all panels, data are mean±SD. *: P<0.05; **: P<0.01; ***: P<0.001.

