Figure 6.
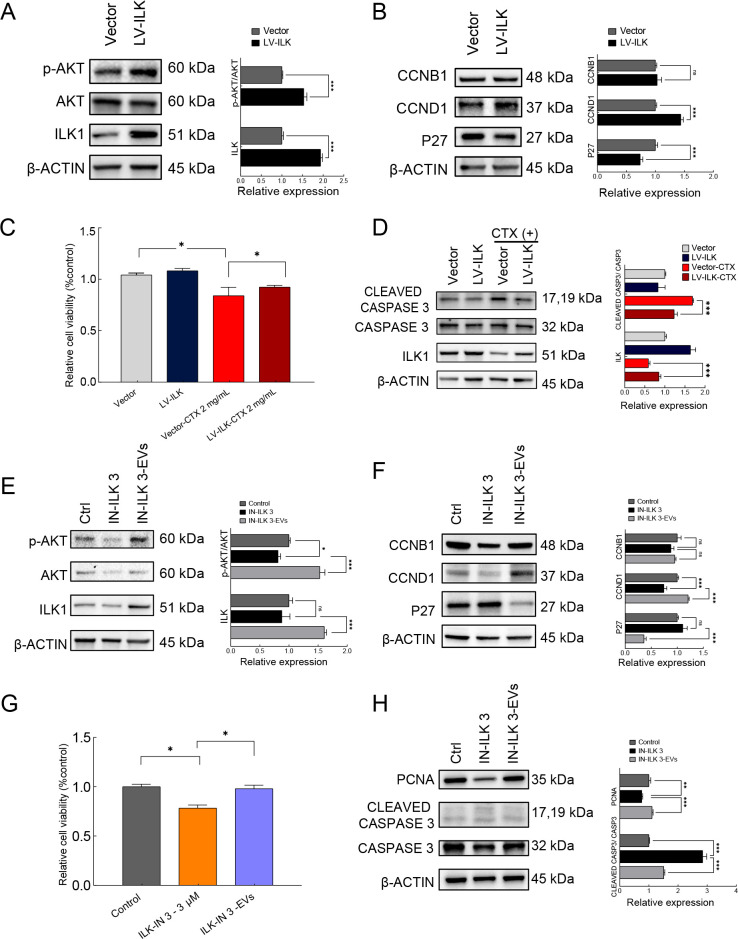
iPSC-MSC-EVs alleviated chemotherapy-induced ovarian injury through up-regulation of ILK/AKT pathway
A: Expression levels of ILK, AKT, and phosphorylated AKT (Ser 473) in vector control and ILK overexpression (LV-ILK) groups detected by western blot analysis. Protein expression levels were quantified by ImageJ (right panel). B: Expression levels of cell cycle-related proteins P27, CCNB1, and CCND1 in vector control and LV-ILK groups detected by western blot analysis. Protein expression levels were quantified by ImageJ (right panel). C: Granulosa cell viability in vector group and ILK overexpression group (LV-ILK) treated with or without CTX (2 mg/mL), determined by MTS assay (n=3). D: Expression of CLEAVED CASPASE3 and CASPASE3 in vector, LV-ILK, CTX-treated vector, and CTX-treated LV-ILK groups detected by western blot analysis. Protein expression levels were quantified by ImageJ (right panel). E: Western blot analysis of expression of ILK, AKT, and phosphorylated AKT (Ser473) in control, ILK inhibitor ILK-IN3 (10 μmol/L) treated, and ILK-IN3 plus EV (20 μg/mL) co-treated granulosa cells. Protein expression levels were quantified by ImageJ (right panel). F: Western blot analysis of expression of cell cycle-related proteins P27, CCNB1, and CCND1 in control, ILK-IN3 (10 μmol/L), and ILK-IN3-EV groups. Protein expression levels were quantified by ImageJ (right panel). G: Granulosa cell viability in control, ILK-IN3 (10 μmol/L), and ILK-IN3-EV groups, determined by MTS assay (n=3). H: Western blot analysis of expression of PCNA, CLEAVED CASPASE3, and CASPASE3 in control, ILK-IN3 (10 μmol/L), and ILK-IN3-EV groups. Protein expression levels were quantified by ImageJ (right panel). In all panels, data are represented as mean±SD. *: P<0.05; **: P<0.01; ***: P<0.001.

