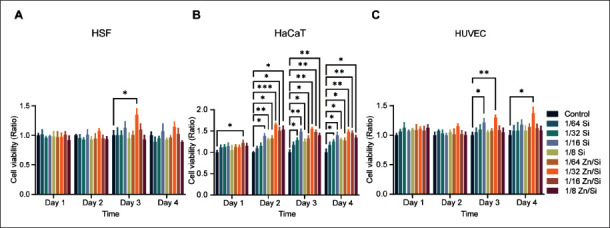
Figure 2.

Cell viability of cells cultured with different concentration of ions. (A) Percent of the viability of HSFs co-cultured with different concentrations of ions. (B) Percent of the viability of HaCaTs co-cultured with different concentrations of ions. (C) Percent of the viability of HUVECs co-cultured with different concentrations of ions. *P < 0.05, **P < 0.01, ***P < 0.001. N = 3 for each time point. All the analyses were performed with two-way ANOVA.
