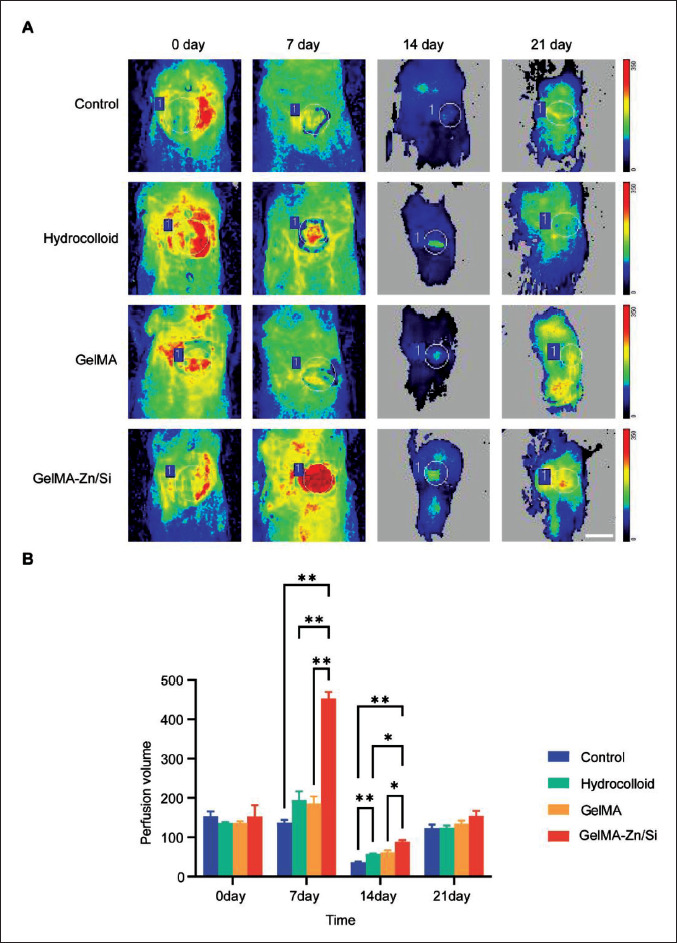
Figure 8.

The blood flows at the wounds were measured by laser Doppler of animals. (A) Representative images of blood perfusion volume. The circle represents the position of the material. (B) Quantitative analysis of blood flow. N = 3 for each group. *P < 0.05, **P < 0.01. All the analyses were performed with two-way ANOVA. Scale bar = 1 cm.
