Figure 3.

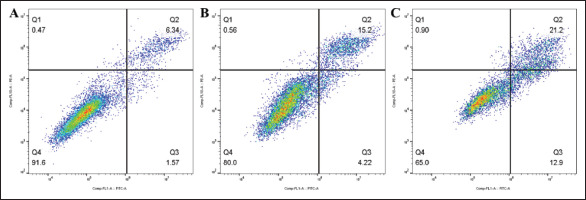
Apoptosis test. (A) The percentage of viable cells in the blank control group was 91.6%. (B) The percentage of viable cells in the OHS group was 80.0%. (C) The percentage of viable cells in the APS group was 65.0%.

Apoptosis test. (A) The percentage of viable cells in the blank control group was 91.6%. (B) The percentage of viable cells in the OHS group was 80.0%. (C) The percentage of viable cells in the APS group was 65.0%.