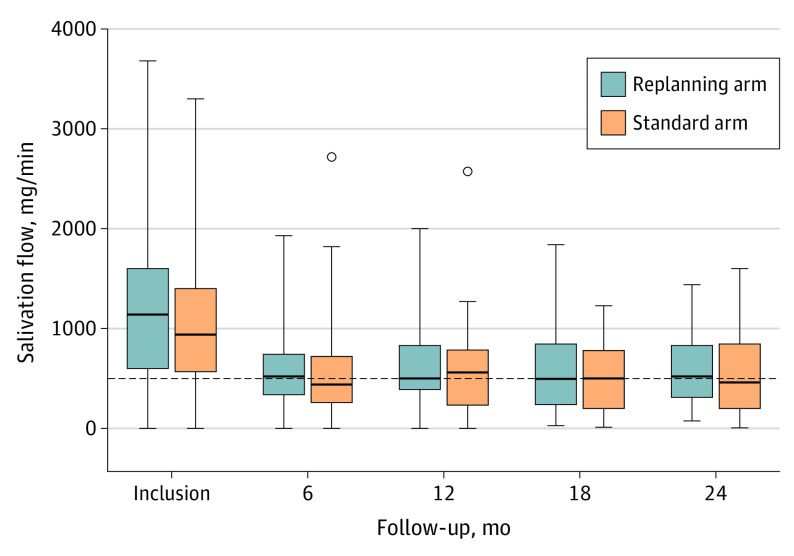
Figure 2. Changes in Salivary Flow After Stimulation by Paraffin in the Intent-to-Treat Population.
Salivary flow was calculated as the weight of the saliva sample in milligrams divided by the sample collection time in minutes. Xerostomia was defined as a salivary flow of less than 500 mg/min (horizontal dashed line).30 The horizontal line within the boxes indicates the median; the lower and upper ends of the boxes, the first and third quartiles, respectively; whiskers, ranges; and dots, outliers.

