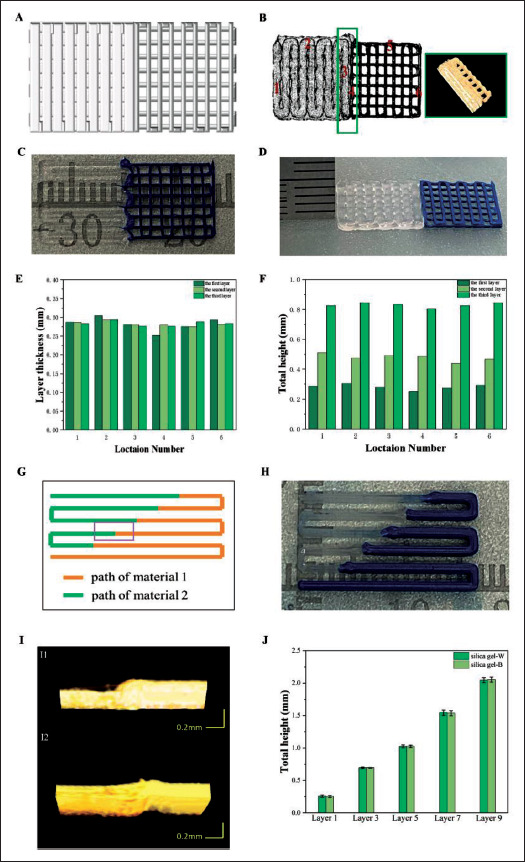
Figure 11.

Multi-layer scaffold design and printing results. (A) Designed path of three-layer scaffold. (B) OCT data projection of optimized three-layer scaffold and OCT data reconstruction map of the box area. (C) Printed three-layer scaffold before optimization. (D) Printed three-layer scaffold after optimization and actual layer thickness. (E) Layer thickness distribution at different locations in different layers of three-layer scaffold. (F) Total height at different locations in different layers of three-layer scaffold. (G) Designed path of nine-layer scaffold. (H) Printed nine-layer scaffold after optimization. (I) The OCT data reconstruction map of the same connection point during printing. I1 is before nozzle control optimization and I2 is after the optimization. (J) Total height in different layers of nine-layer scaffold.
