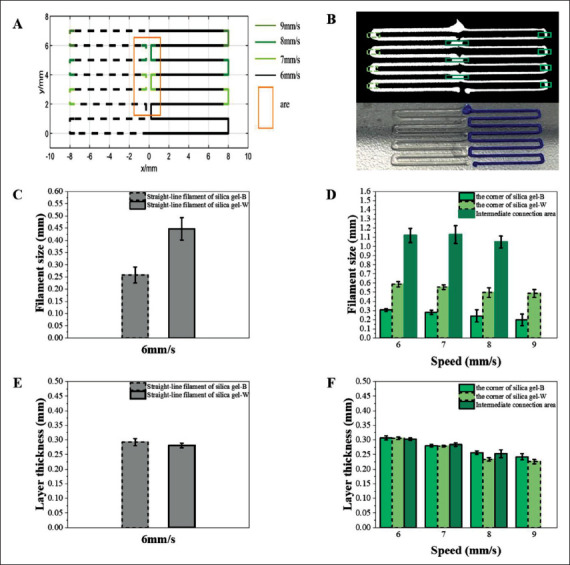
Figure 7.

Path design and experimental results. (A) Designed path, where the solid line is the printing path for silica gel-B, and the dotted line is the printing path for silica gel-W. (B) OCT data projection diagram and printed result. (C) Filament size of the printed results with different material at the speed of 6 mm/s. (D) Filament size of different corner positions at different speeds. (E) The layer thickness of printed filament with different materials at 6 mm/s speed. (F) Layer thickness of different corners at different speeds.
