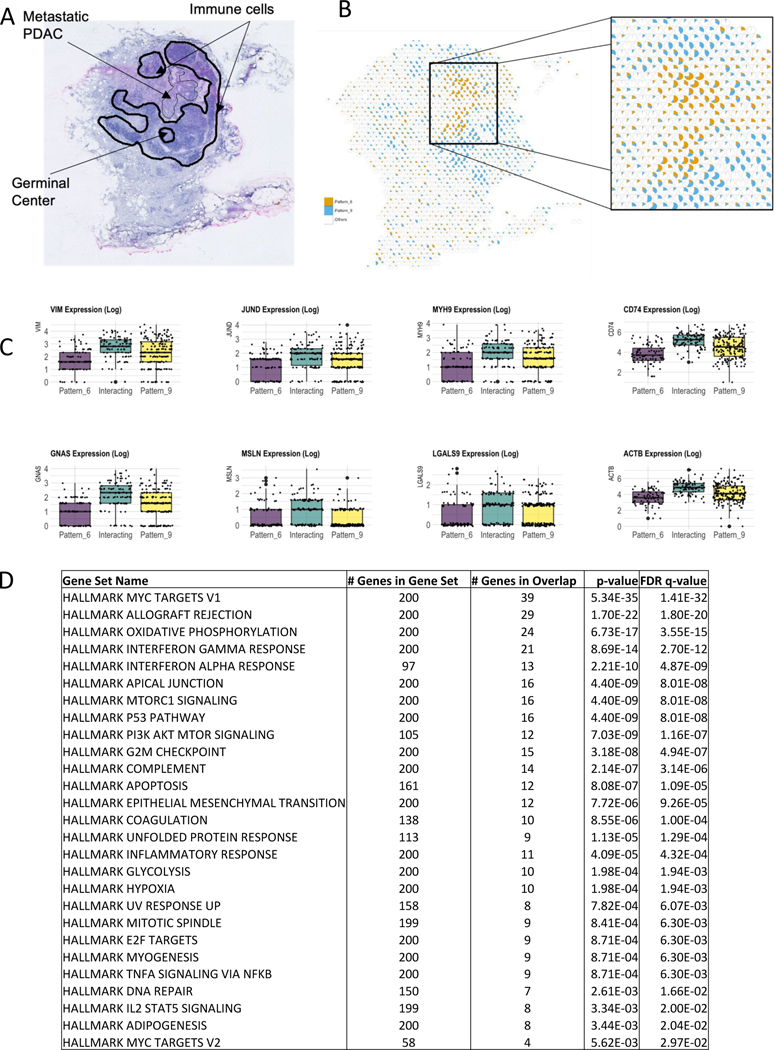
Figure 2.
SpaceMarkers identifies molecular changes associated with immune-metastatic pancreatic cancer interaction in the lymph node
A. H&E staining of a peritumoral pancreatic lymph node with metastasis from PDAC (arrow) and annotated germinal center and immune cells (dark lines).
B. Visualization of the relative activity in the CoGAPS patterns associated with metastatic PDAC (Pattern 6) and immune cells in the lymph node (Pattern 9). Each spot is represented as a pie chart with fractional gene expression at the location aggregated over the all genes for Pattern 6 (orange), Pattern 9 (blue), and all Other patterns put together (white).
C. Boxplots of the expression of selected genes showing higher expression levels in the interaction region of Pattern 6 and Pattern 9 compared to the regions with exclusive influence from Pattern 6 and Pattern 9 respectively.
D. Table showing Hallmark gene set pathways significantly overrepresented in the region of interaction between Pattern 6 and Pattern 9, with size of overlap and FDR value (see Table S2 for KEGG and Biocarta pathways).

