
Figure 6.
Contextualizing scRNAseq data using SpaceMarkers and transfer learning from matched ST-scRNAseq data in HCC (see also Supplemental Figures S5 and S6).
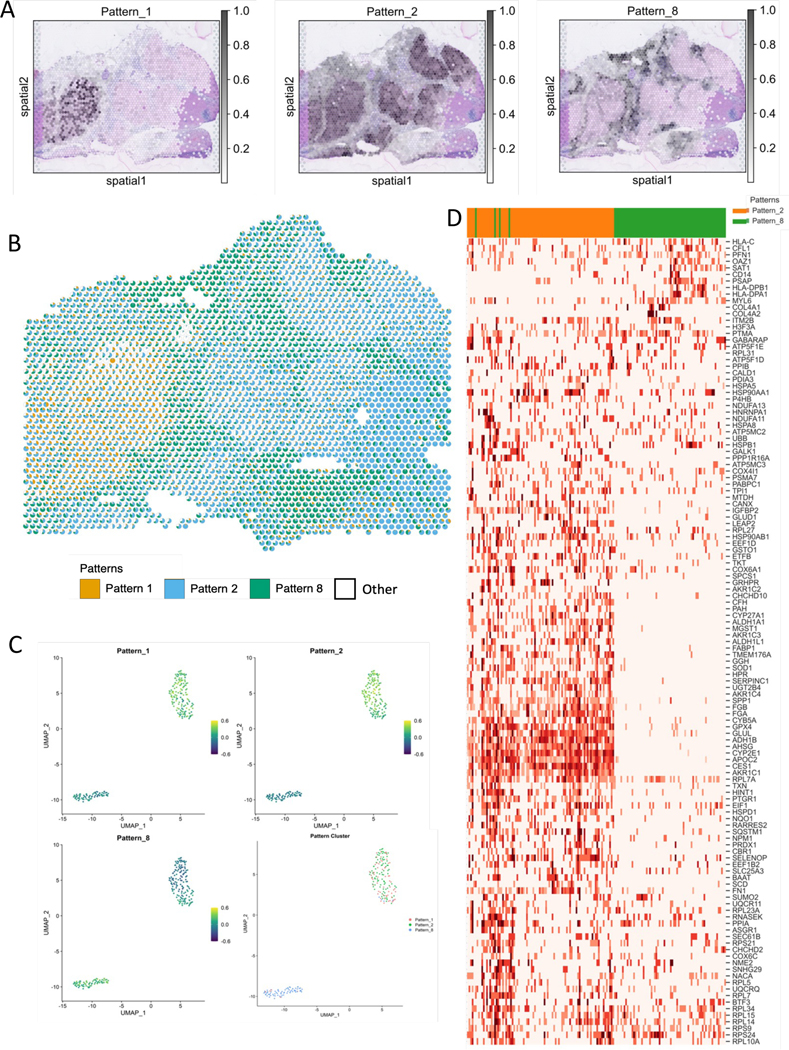
A. CoGAPS factorization reveals spatial patterns associated with tumor annotations of tumor and immune cells. (see Supplemental Figure S5).
B. Scatterpie visualization shows the relative pattern activity levels associated with the spatially overlapping tumor (orange) and immune (blue) patterns in each Visium spot using a pie chart (white represents activity from all other patterns). SpaceMarkers are genes exhibiting nonlinear effects in the residual space of the CoGAPS patterns in the region with tumor-immune overlap.
C. Transfer learning of Patterns 1, 2, and 8 from ST data to matched scRNAseq data. Scatter plot shows projections of the spatial patterns onto individual cells in the scRNAseq data. Individual cells in the scRNAseq data are associated with the pattern having the highest projection in the cell.
D. Expression heatmap of SpaceMarkers in tumor and immune cells from matched single-cell data from the same tumor provide the spatial context of the individual cells.