Figure 3.

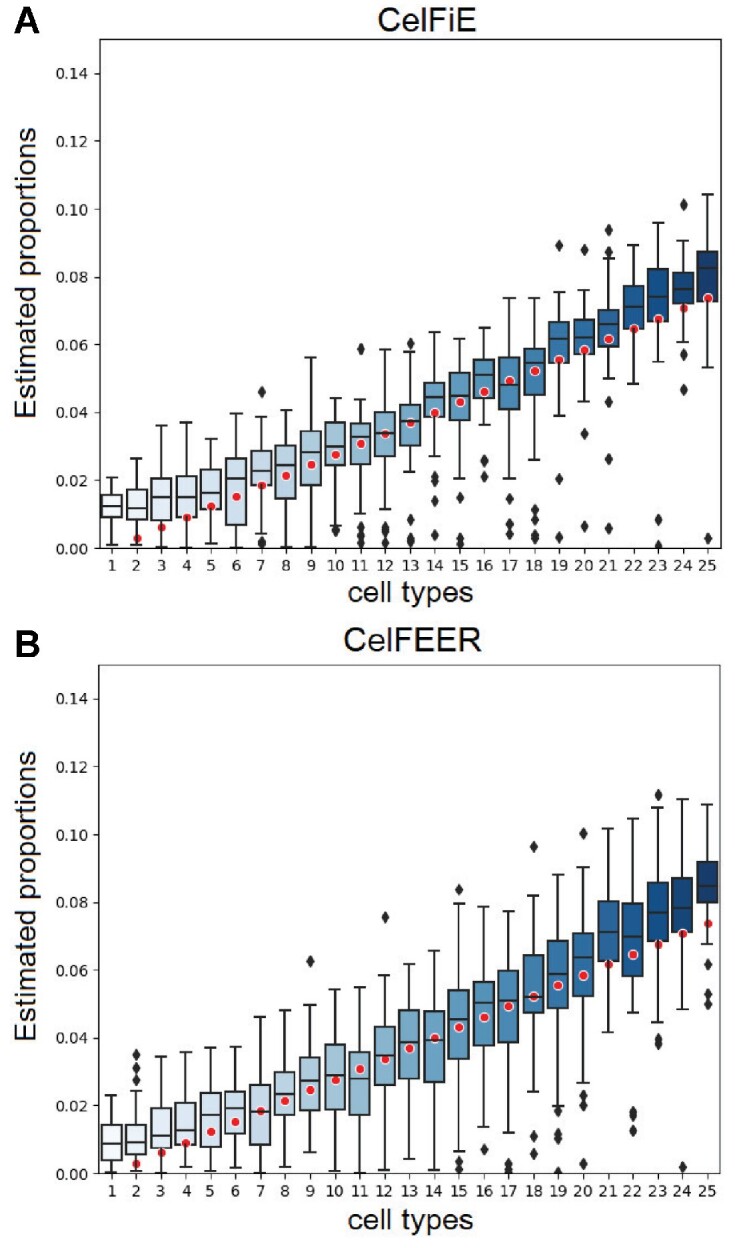
Simulations on generated data for one individual. Each boxplot displays the estimated proportion of a cell type for replicate model runs. The red dots indicate the true cell type proportions for 25 cell types.

Simulations on generated data for one individual. Each boxplot displays the estimated proportion of a cell type for replicate model runs. The red dots indicate the true cell type proportions for 25 cell types.