Figure 4.

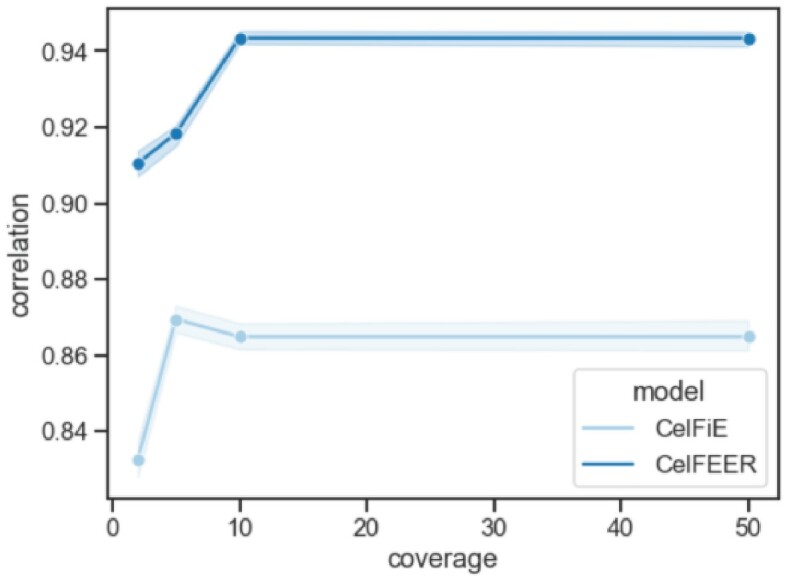
Relation between the input coverage and the correlation between the estimated and true cell type proportions. The full range of the correlations of 100 individuals and 50 replicates is highlighted.

Relation between the input coverage and the correlation between the estimated and true cell type proportions. The full range of the correlations of 100 individuals and 50 replicates is highlighted.