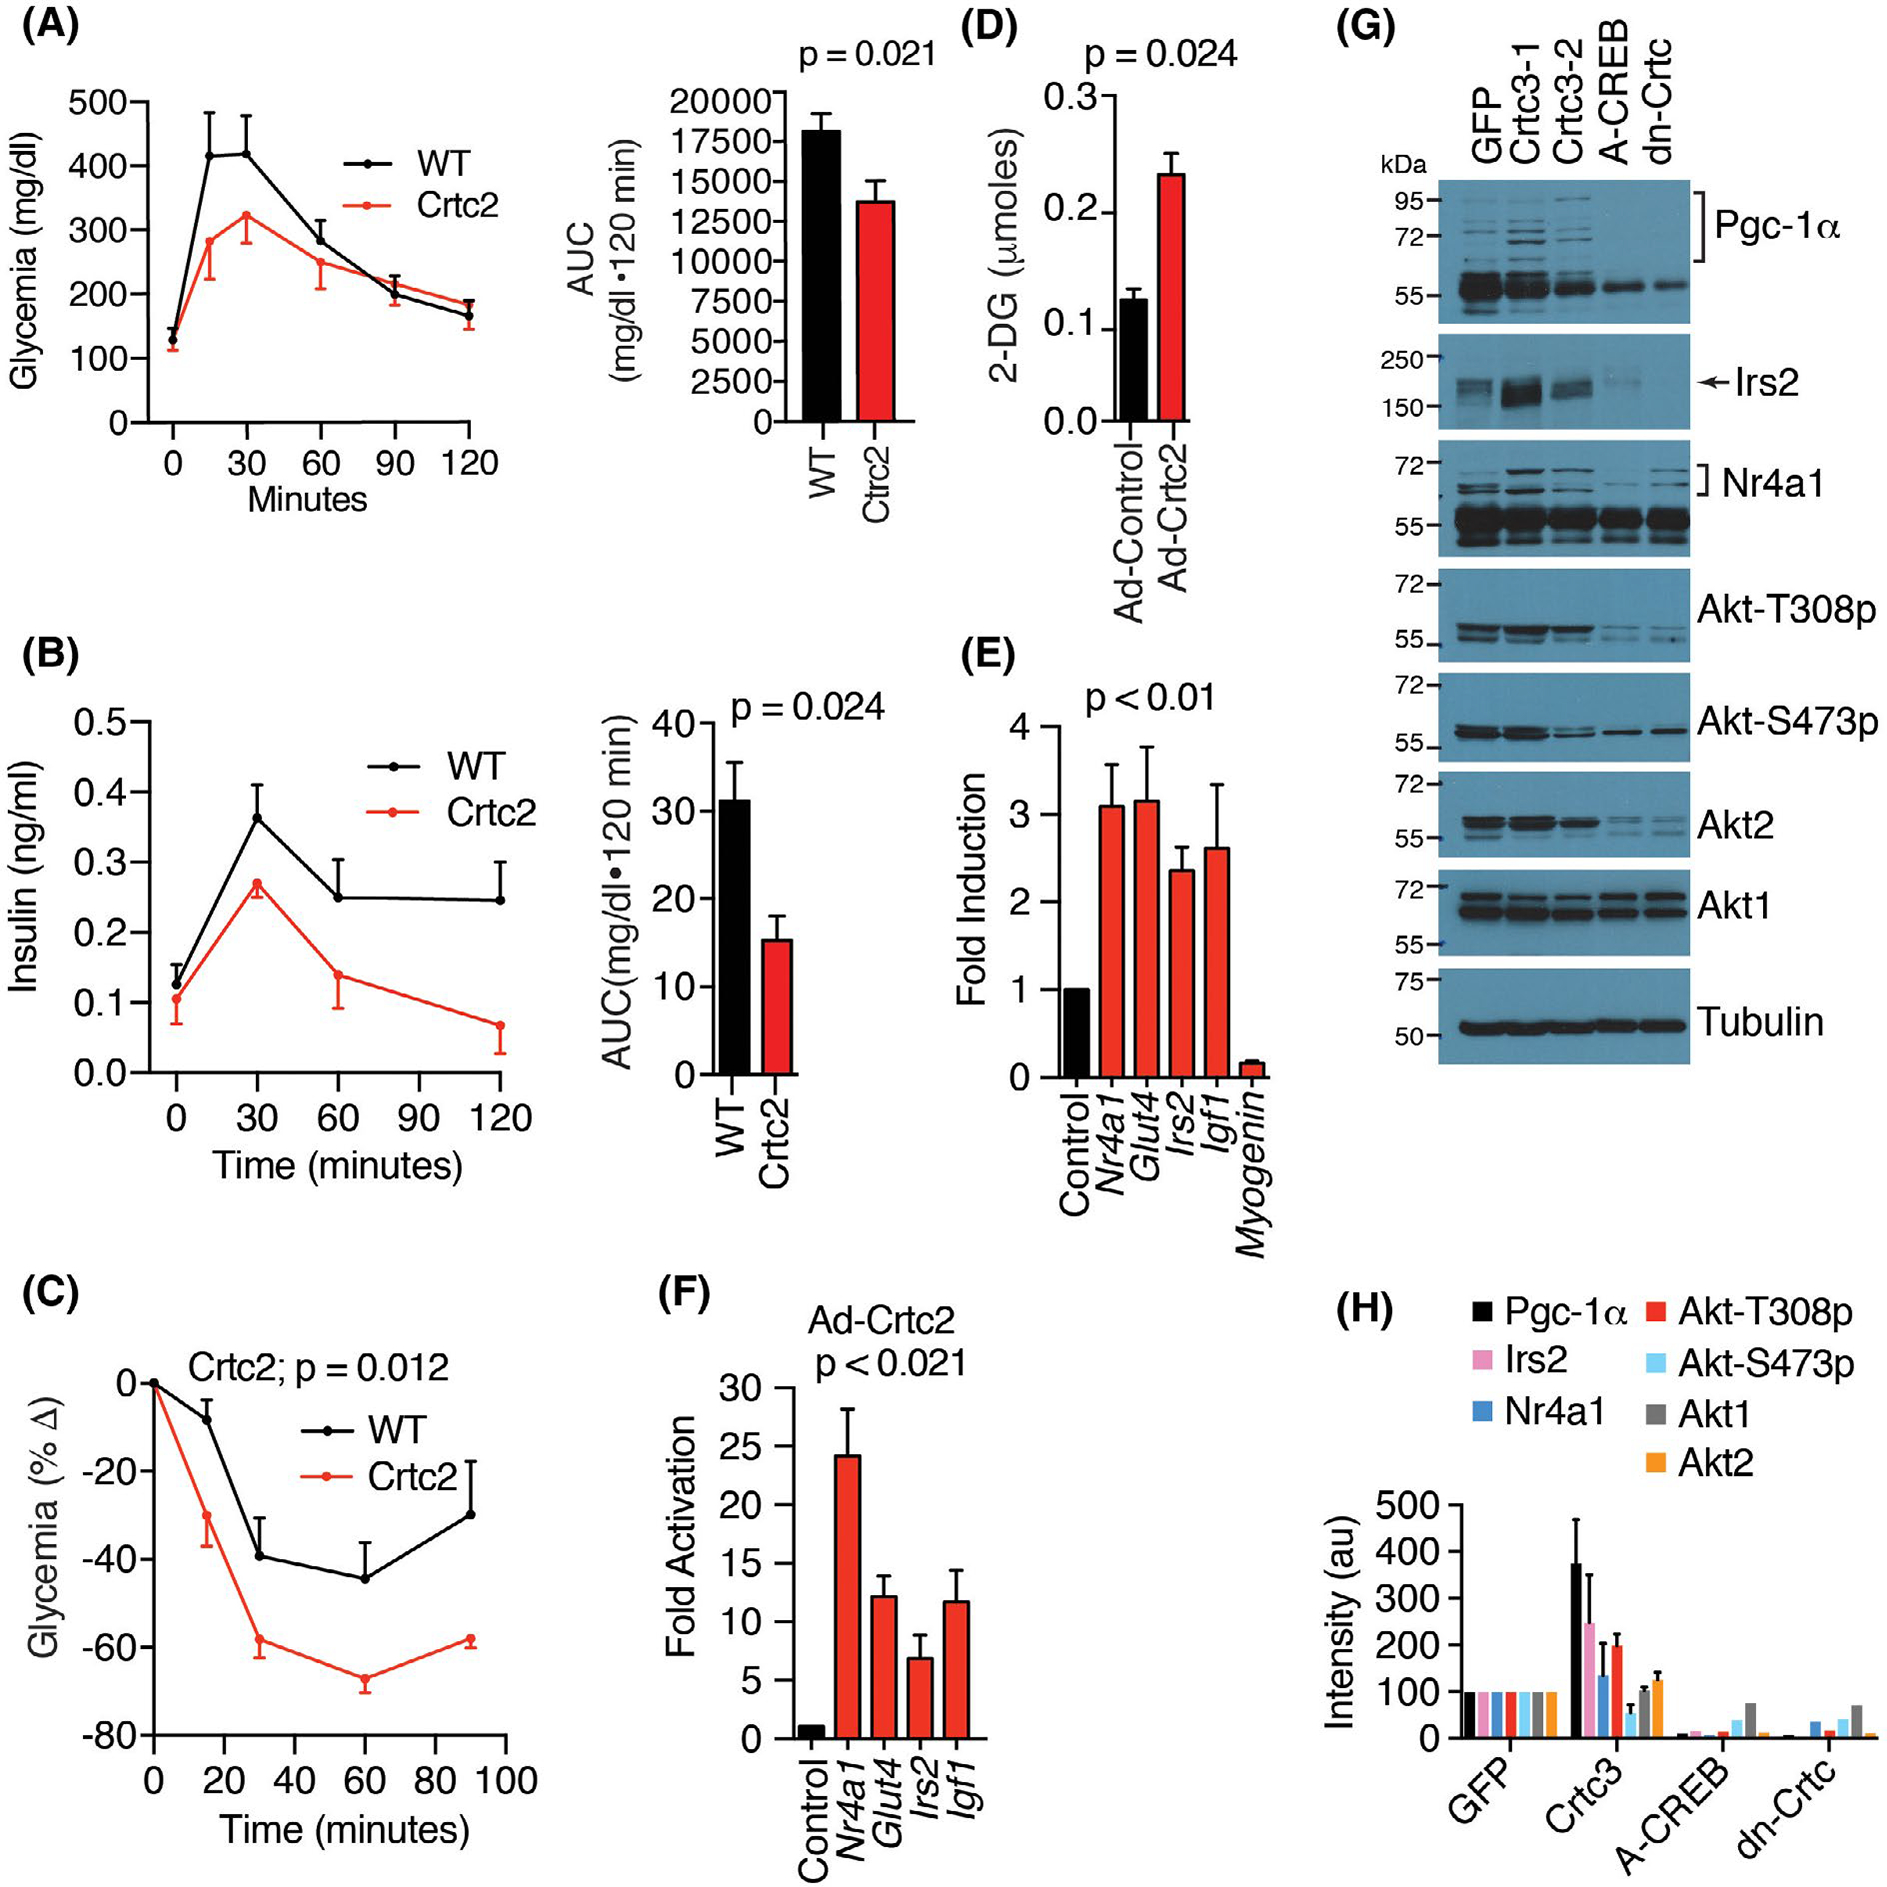
FIGURE 2.

Crtc2 transgenic mice maintain enhanced glucose disposal and insulin tolerance. (A) Glucose tolerance test (GTT). Right panel, area under the curve. N = 10 mice per group. (B) Plasma insulin levels during GTT described in panel B. (C) Insulin tolerance tests. N = 10 mice per group. (D) Insulin-mediated uptake of 2-deoxy-D-glucose in primary myocytes transduced with adenovirus expressing Crtc2 or GFP control. N = 10 per group. Student’s t-test. (E) Crtc2 mice were treated +/− dox for 1 week and the gene induction compared by qPCR relative to the no dox groups. N = 10 mice per group. (F) Gene expression in primary myocytes transduced with adenovirus expressing Crtc2 or GFP control were compared by qPCR. N = 4 per group. (G) Myocytes stably expressing GFP, Crtc3 (lanes 2 and 3), dominant-negative Creb (A-CREB), or dominant-negative Crtc2 (dn-Crtc) were compared by western blot. See also Supporting Information Figure S3. (H) Quantitation of western blots shown in panel G. Arbitrary units (au). Data are mean ± SEM
