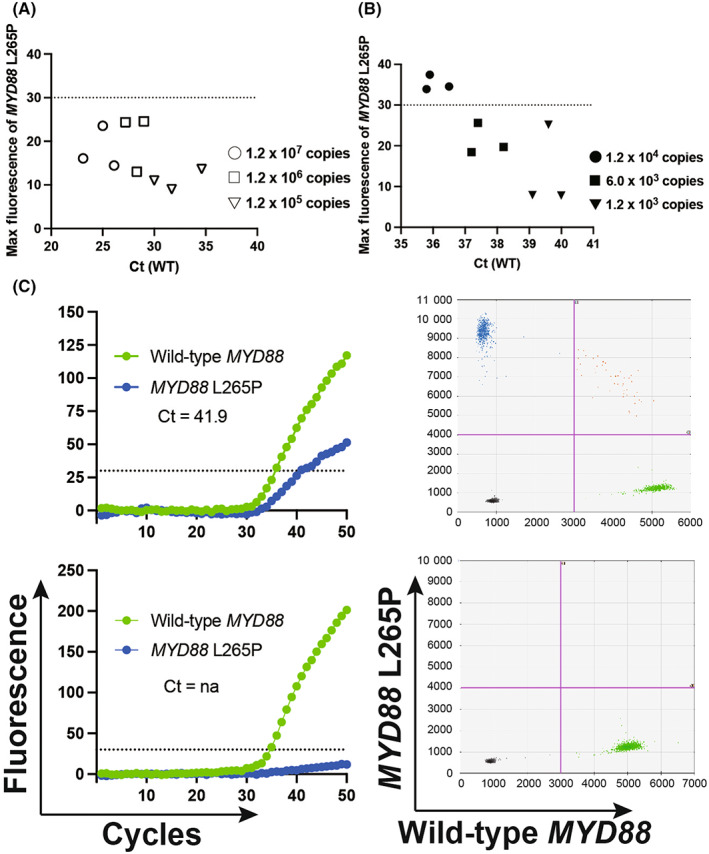
FIGURE 2.

Sensitivity and specificity of genotyping of MYD88 L265P using GeneSoC. (A) Dot plot showing the max fluorescent intensity of the MYD88 L265P mutation (FAM) of plasmids containing the MYD88 wild‐type sequence based on increasing concentrations. (B) Dot plot showing the max fluorescent intensity of the MYD88 L265P mutation (FAM) plasmids containing 5% MYD88 L265P sequence based on serial dilutions. (C) Genotyping using GeneSoC (left) and ddPCR (right). The upper panel displays the result based on the frozen sample of the PCNSL case, and the lower panel displays the results based on the frozen sample of the glioblastoma case. The pink line in the ddPCR result indicates the threshold (FAM; 4000, HEX; 3000).
