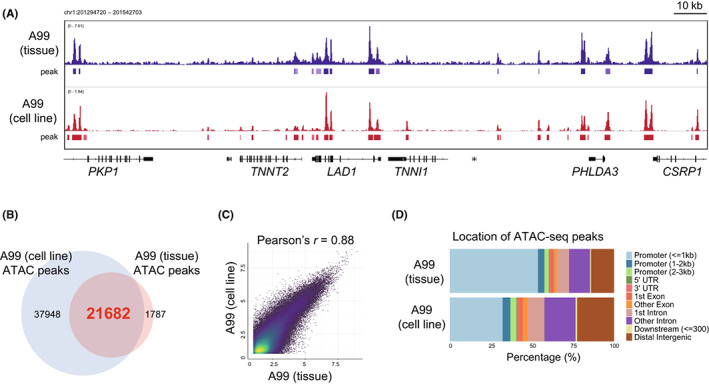
FIGURE 1.

Comparison of open chromatin status between A99 frozen tissue and A99 cell line. A, IGV visualization of assay of transposase‐accessible chromatin sequencing (ATAC‐seq) signals of A99 frozen tissue (upper) and A99 cell lines (lower), which we previously established from surgically resected tumor tissue specimens. B, Venn diagram showing overlapped ATAC‐seq peaks between A99 frozen tissue and A99 cell line. C, Correlation plot showing ATAC‐seq signals in the shared peaks between A99 frozen tissue and A99 cell line. The x‐axis and y‐axis indicate log2‐transformed normalized counts. D, Bar chart showing the location of ATAC‐seq peaks in A99 frozen tissue and A99 cell lines
