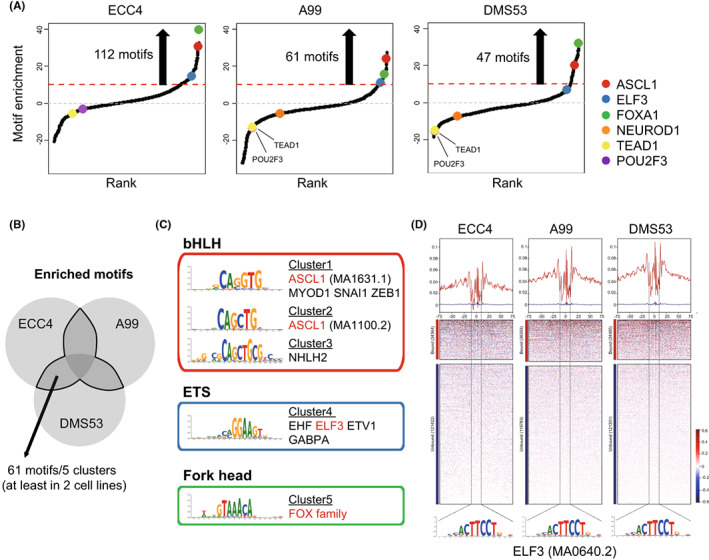
FIGURE 3.

Motif enrichment in ECC4, A99, and DMS53. A, Motif distributions in ECC4, A99, and DMS53. Motifs were plotted in increasing order based on their deviation scores. B, Venn diagram showing overlapped enriched motifs in ECC4, A99, and DMS53. C, Motifs were clustered according to motif sequence similarity. Representative transcription factors for each cluster are presented. D, Chromatin accessibility footprints of ELF3 within all accessible loci for ECC4, A99, and DMS53
